


If you want to achieve great results and choose only efficient tools, our review will help you with this. In this article, we will tell you what trading tools are, how to choose them, and use them properly.
However, if you are willing to learn about the basics of trading, we recommend you read the article What do you need for Forex trading. Here you can find the most crucial information about trading regardless of your experience.
Trading tools in nutshell
The trading industry is constantly developing. It means that investors should be more alert to changes. They need to adapt quickly in order to use novelties to their own advantage. Interestingly, oftentimes, they have to compete not only with other traders but also with robots and various software.
However, it does not mean that investors have no chance of success. On the contrary, there are plenty of opportunities to achieve breathtaking results.
In trading, it is not enough to wish for things. One should act.
Before you start trading, you need to access your:
- knowledge;
- trading skills;
- analytical skills:
- tools at your disposal that can help you significantly in trading.
Here are the most popular trading tools:
- Trading platforms, including mobile trading platforms;
- Trading platforms, including mobile apps;
- Advisors that generate trading signals;
- Economic calendar which includes all the important market-driving events;
- Analytical platforms that simplify trading analysis;
- Indicators are special algorithms that identify price patterns and help traders predict the trajectory of a trading instrument.
These are the main trading tools. Let’s discuss them all in detail.
Importantly, there are plenty of other trading tools, excluding those we have just mentioned. Those tools can greatly facilitate your trading as well.
Here are some examples:
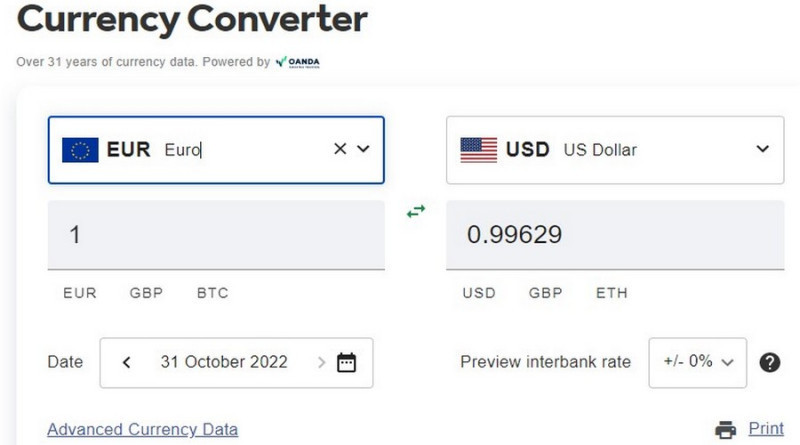
- currency converters that help instantly convert one currency into another at the current exchange rate;
- various calculators. For example, there are services for calculating the potential profit from a transaction, volatility, pip, margin calculators, etc.
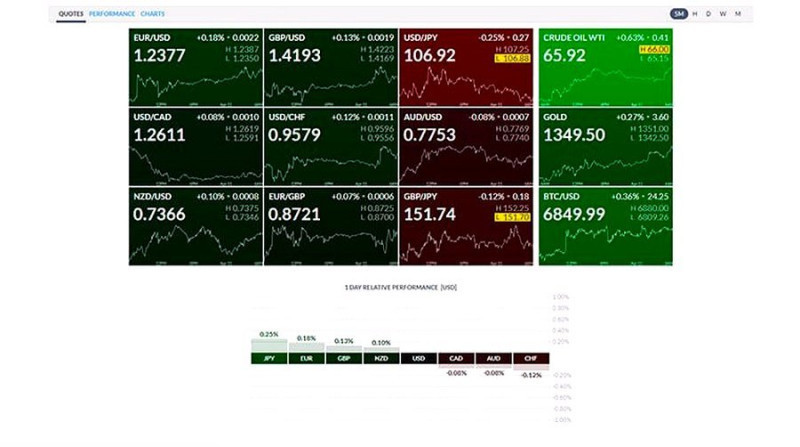
- heat maps of assets They are largely used for currencies. This tool enables you to visually assess the market situation and see the price changes from lows and highs for a certain period of time.
These tools are available on the list of tools provided by brokers. They can also be placed on special analytical platforms or provided by developers as separate software.
You may have encountered the term "financial instruments". We will also pay attention to this topic in our review.
Trading platforms: what are they used for?
Trading platforms are special software that enables speculators to perform trading transactions. Trading is impossible without them given the variety of functions they include.
By using trading platforms, investors are able to:
- open and close trades;
- adjust trades;
- place Stop Loss orders;
- analyze charts and use them in trading;
- apply indicators;
- manage their deposit.
There are several approaches to classifying trading platforms:
- There are platforms that require downloading and browser-based ones. In the first case, users install a special program on their devices. Web-based trading platforms allow speculators to trade directly from their browsers.
- Both options do not require deep knowledge of technical peculiarities. It is enough to use the links provided by the broker and then – follow the instructions;
- There are desktop and mobile versions. In this case, it depends on the device on which you install your trading platform.
Desktop versions are designed for desktop computers and laptops, mobile ones are used for smartphones and tablets.
The main advantage of mobile applications is that they are always at your fingertips. Thus, speculators can trade anywhere provided that there is an Internet connection.
As for desktop trading platforms, you will be unable to manage your trades if you go outside, especially if you use a computer. However, quite often desktop versions have a wider array of functions compared to mobile ones. Apart from that, the screens of stationary devices are larger than those of smartphones and tablets. There is less strain on vision and a low risk of not noticing something important.
Each broker has a list of available trading platforms. If you have found a platform suitable for you, but it is not on the list of your broker, you either need to look for another broker, or select another platform.
The most popular trading platforms are the MetaTrader ones – MT4 and MT5. Most brokerage companies offer them for trading.
In addition, they can provide their own software. For example, apart from MetaTrader, InstaForex has plenty of other options.
How to use economic calendar
As practice shows that sharp price swings occur against the background of important economic events such as crucial news and publications of macro stats. These events may trigger high volatility resulting in an increase or a drop in the price.
The main purpose of fundamental analysis is to predict such fluctuations.
What can impact an asset price?
- Important political events such as elections, meetings of lawmakers at various forums, and talks over some issues;
- Force majeure: natural or man-made disasters, military conflicts, and so on;
- Economic forecasts;
- Publication of macro stats;
- Statements of politicians, economists, and influential businessmen.
The economic calendar is a very useful tool for investors as it includes all crucial fundamental factors. This is a systematized table in which important economic events are presented in chronological order.
It usually includes:
- speeches about the state of global and domestic economies;
- weekly or monthly macroeconomic reports;
- outlook for a particular sector of the economy;
- macroeconomic and microeconomic reports.
By using the economic calendar, you can see what event will happen on a particular day and predict how it could affect the market sentiment. The forecast is usually made according to analysis provided by market experts.
The economic calendar also contains previous data on specific economic indicators, which makes it possible to assess their dynamic.
Here are the main indicators that you should pay attention to when trading:
- gross domestic product: if it is growing, the economy of a certain state is expanding. It means that the national currency of this country is likely to start an uptrend as well;
- consumer price index: when it soars, the national currency usually depreciates. Inflation corresponds to a drop in the purchasing power of money;
- the unemployment rate: its decline signals economic stability. If it advances, it means a negative trend.
- key rates of central banks: by tightening monetary policy states usually push inflation down. However, it slows down economic expansion.
Economic calendars are filled with lots of events. If you do not want to miss the most significant ones, pay attention to the above-mentioned indicators.
Usually, there is a Sort function in economic calendars. So, you can choose which events you are largely interested in. Sometimes, for the convenience of users, they even have a built-in interactive guide that helps to understand how it works.
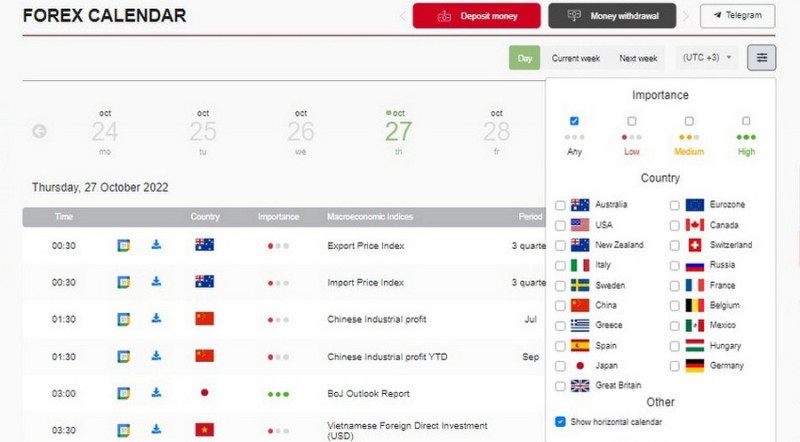
Here is an example of using data from the economic calendar. Let's say we are going to make money on the euro/dollar pair.
It means that we need to monitor economic news in the US and the EU. We set these parameters by clicking the list of states in the calendar filters.
We can also structure all the data according to our trading plan and purposes.
The system will give you the search results: the macroeconomic indicator, its previous value, forecast, and actual data. If the figure turns out to be better than expected, it means there are no big negative trends in the economy.
After that, we compare the indicators for the US and the eurozone. Based on this, we make conclusions about the trajectory of the euro/dollar pair.
To confirm the forecast, we use technical indicators and make transactions according to our strategy.
There are two ways of trading based on data obtained from the economic calendar.
The first one implies making trades before the news release. For example, if the forecast is optimistic, one should go long. In case of pessimistic predictions, it is recommended to open short positions.
In the first case, you open trades before the news is published. The second option is less risky. Speculators make positions immediately after the publication of the economic report, comments of policymakers, etc.
At this time, the trajectory of price has already become clear and you can open positions according to the main trend.
Economic calendars are available on the websites of almost all brokers. They can also be found on analytical and financial platforms. For instance, in the MetaTrader platform, the economic calendar is placed in the "Tools" section.
For the convenience of customers, the developers have even provided the option of downloading the economic calendar on a mobile app.
Analytical platforms
Analytical platforms open up new opportunities for users and simplify their work. These are special websites that contain informational, statistical, and analytical content useful for market participants.
Here are some of them.
1. Finviz.com is a website that provides analytical content on stocks, futures, currency pairs, and digital assets. Its main advantage is the visual charts of market trends and a wide variety of available filters.
The main functions of Finviz.com are free. The number of multipliers depends on the asset: for example, for shares, their number can reach 70.
The website also has a news feed, a heat map, and even information on insider transactions;
2. Market Chameleon is another useful web tool that allows you to analyze the stock market. The most valuable information that can be used is data on the number of long and short positions on stocks at the close of trading.
If there is a sharp and significant increase in short positions, the downtrend prevails;
3. TipRanks is a website where you can read analysis articles about stocks as well as evaluate the accuracy of forecasts of various analysts. If an analyst or a team of experts inspire trust, you may follow their recommendations on short and long positions;
4. Investing.com is a well-developed platform available in multiple languages. It is used in 30 countries around the world. The content is localized for a specific region and includes quotes, macro stats, charts, analysis articles, news, and so on.
You can also find information on about 300,000 assets on the platform, namely currency pairs, stocks, indices;
5. TradingView is considered one of the best and most advanced tools for technical analysis. It can boast of accurate quotes, a variety of indicators, timeframes and alerts, and support 21 languages.
TradingView also provides a space for traders to communicate and exchange trading ideas as well as make forecasts. According to the latest data, about 30 million people worldwide visit the website every month;
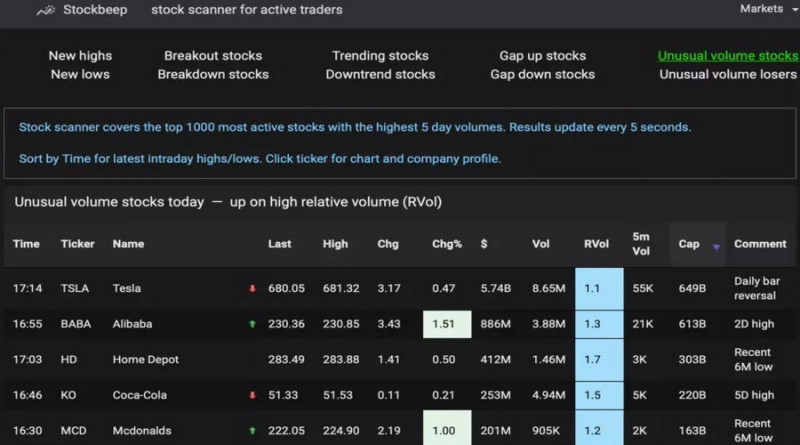
6. StockBeep is useful for stock traders. It shows the most liquid shares.
Based on this information, traders decide whether to open a long or short position.
These are just some of the options. In addition, new analytical platforms are constantly appearing in the market that can be of big help to traders.
Indicators
Technical indicators are algorithms that are used to predict the movement of an asset's price. These are exclusively mathematical tools that are not based on fundamental factors.
In trading, technical indicators help market participants identify the perfect entry points for short or long positions,
They are used by many traders regardless of their experience. Algorithms can be complex and simple, leading and lagging.
There are hundreds of them. If you are a novice trader, you should use more than three indicators at the same time. If you apply lots of indicators on the chart, they will overlap with each other and can confuse even experienced investors, not to mention beginners.
Here are the most popular ones:
- trend indicators determine the prevailing trend. It can be a bullish or a bearish one:
- oscillators are algorithms that show when an asset becomes extremely oversold or overbought. It is important for traders to know this information, because after that, oftentimes, a price reversal occurs;
- volume indicators: the name of this algorithm speaks for itself. At the same time, you need to understand that volume on forex is the number of lots traded in a currency pair within a certain time period. So, it differs from the concept of volume applied to other markets;
- channel and level are used to build price zones, support and resistance levels, and so on.
As a rule, a certain list of indicators is already built into the platform. For example, on MT4, there are 30 indicators and on MT5 you can find 38 indicators.
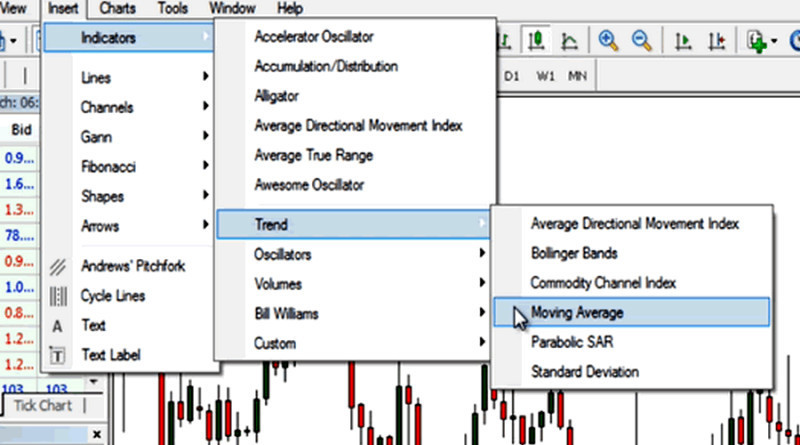
Additional indicators can be found on the Internet and added to your platform. Another option is to find a suitable one in the MetaTrader's Market.
Please note that some indicators may be available only after payment as they are copyrighted. Brokers usually have their own indicators and most often they do not take money from customers for their use.
TOP-5 technical indicators:
- Moving Average demonstrates the average value of the asset for a selected period of time. This is a trend indicator that helps you determine not only the direction of the price but also the potential rise or decline in it;
- RSI is an oscillator that shows the speed and amplitude of changes in an asset price and signals possible reversals;
- MACD is an oscillator that uses MAs of different periods;
- Stochastic is an oscillator that demonstrates the current price of an asset relative to the price range in the past;
- Bollinger bands are an oscillator that reflects current price deviations and is used to determine volatility.
Trading instruments
Traders always strive to reap a profit from price swings. The assets are called financial instruments.
They include:
- currency pairs;
- stocks and bonds;
- precious metals;
- cryptocurrencies, etc.
Each financial instrument has its own denomination and price. It is traded in a particular market, e.g. stock, crypto, or forex
Usually, investors prefer assets with high volatility and liquidity as such financial instruments allow them to get bigger profits.
This is why it is so important that they choose the right trading instrument. We will tell you about the main features of some of them.
1. Currency pairs. According to statistics, currency pairs are the most popular instrument among beginners and experienced market participants.
At the same time, it is not recommended to trade highly volatile currency pairs if you are a newbie. If the price changes quickly and an investor does not have enough experience, the risks of financial losses are high.
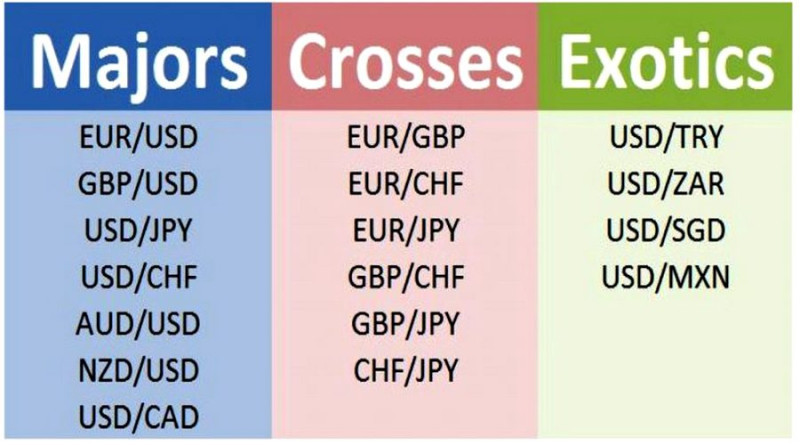
It is better to add to your portfolio currencies with a high level of liquidity such as the US dollar (EUR/USD, USD/CHF, and so on).
There are many different currency pairs you can trade from the majors to crosses and exotics. The second group includes currencies that are not quoted against USD. Exotic pairs usually consist of a major currency alongside a thinly traded currency or an emerging-market currency, for example, those that contain the Turkish Lira or Mexican Peso.
Exotic pairs are characterized by low liquidity. If you are a beginner, it is better not to trade such currencies.
2. Cryptocurrencies. Despite their short existence, they have gained popularity among traders. Nowadays, there are plenty of crypto enthusiasts.
Digital money is quite attractive because it creates great opportunities for traders to make money on sharp price fluctuations. Having cryptocurrencies in your investment portfolio is not only trendy but also useful.
However, these financial instruments have their own peculiarities. Firstly, it is difficult to predict their price, which increases the risks in trading.
Secondly, the price is changing rapidly. Altcoins as well as popular crypto assets such as Bitcoin, Litecoin, etc. are vulnerable to dramatic price swings.
For beginners, it would be wise to choose those crypto assets that have lower volatility compared to other digital currencies. They should also be careful about the new altcoins and so-called memcoins, which are in demand only during the hype;
3. Stocks are financial instruments that enable traders to make money on price changes as well as dividends. If you constantly monitor the financial conditions of companies and take into account macroeconomic factors, investing in shares will be rather profitable;
4. Derivatives are contracts that give the buyer the right to buy or sell an underlying asset, for example, stocks or bonds at a specified date.
The main purpose of derivatives is to hedge risks. However, they are largely used for speculation.
Derivatives include futures, CFDs, and forward contracts. For example, futures are a legal agreement to buy or sell a particular commodity asset (hydrocarbons, gold) at a specified time in the future.
Apart from the date, the contract establishes a price that cannot be changed. For example, the parties have agreed that in three months one will buy a certain amount of oil from the other at a price of $85 per barrel.
The parties must fulfill these conditions even if oil gets much cheaper and more expensive within the specified period. Futures are freely traded on the market, which allows you to make a profit when working with them.
Moreover, traders are also interested in cash settlement. Under this method, the contract seller does not deliver the underlying asset but transfers the net cash position. When the validity period of such an agreement ends, one party makes a profit, the other incurs losses. It depends on whether the price climbs or drops.
CFD (Contract for Difference) is an agreement between a buyer and a seller on paying each other the difference in the asset value, e.g. shares. The difference between the open and closing trade prices are cash-settled.
Unlike futures, CFDs are purely speculative instruments as traders never own the underlying asset but rather acquire revenue based on the price change of that particular asset.;
5. Stock indices also belong to derivative financial instruments. However, they represent a separate group of assets.
Each index includes shares of certain companies and serves as an indicator of their performance. For example, the S&P 500 comprises shares of many American companies.
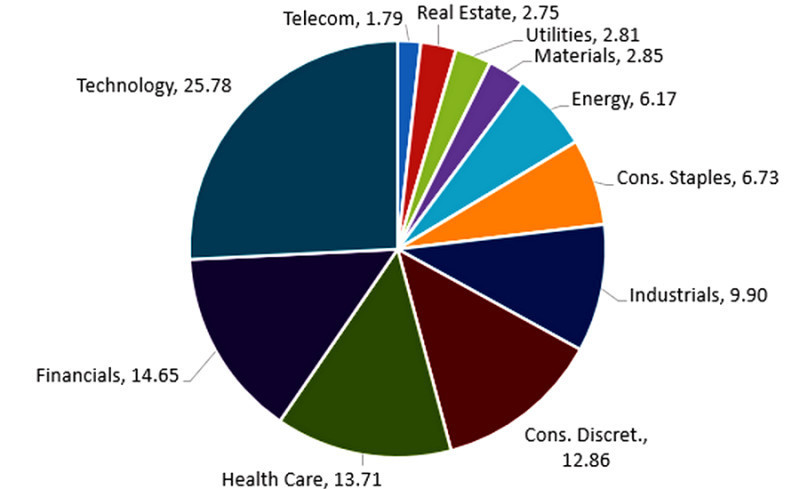
If the index advances, it means that these companies are doing well. If it decreases, the situation worsens.
Trading stock indices is less risky compared to stocks. It is very difficult to artificially influence the cost of indices. Last but not least, indices are less sensitive to external factors.
Here is an example. Let's say that due to force majeure in a particular country, all flights were canceled.
Following such news, the shares of air carriers will immediately fall in price. The stock indices include shares of dozens and hundreds of companies.
Even if the index includes stocks of companies from the airline industry, it will not decline as much as stocks of a particular issuer;
6. Precious metals are considered relatively young trading instruments. They are extremely popular during periods of financial crises and unstable economic situations.
Investors can trade gold, silver, and other metals with the help of CFDs. Demand for non-ferrous metals remains high because of their high liquidity, steady price dynamic, and low volatility.
Trading instruments: how to manage them
Regardless of which asset you have chosen for trading, you should adhere to certain rules, especially if you're a newbie.
Here are some specific features you need to consider before start trading:
- The financial instrument you are planning to work with should be at least familiar to you. The more you know about it, the better;
- If you are just taking your first steps or want to test a new tool, use a demo account. It might also help you to evaluate the effectiveness of new strategies;
- You should not use your last money for trading. Even if the selected financial instruments have high liquidity and the strategy has already been tested, there are always risks of losses;
- Do not trade with all your available funds. You could lose your entire deposit because of one unprofitable position. In trading, the risk per trade should not exceed 3-5%;
- Try to diversify your portfolio. This is the best way to lower risks. You can trade one or two instruments at the start. However, when you become more experienced, you will be able to trade five or six assets;
- Even if you use the most reliable and effective indicators, do not forget about the fundamental factors that can considerably influence the market. You can track all the most important events using the Economic Calendar and read the news feed in the trading platform, on the broker's website, or in other sources;
- Keep up with the times. Study new trends in the market. For example, many savvy investors increase the efficiency of trading by using robots;
- Remember that even the most profitable strategy may lose its relevance over time. As soon as you notice a decline in trading performance, analyze the reasons and, if necessary, make adjustments to your strategy.
Conclusion
In our article about trading tools, we talked about how to make trading more efficient and comfortable. Trading is not just about the opening and closing of transactions with subsequent profit or loss.
Trading requires careful preparation, dedication, and analytical skills. Trading tools can significantly simplify the process of achieving the main task – making a profit.
As for financial instruments, they are an essential part of trading. Speculators make a profit on a rise or fall in their price.
Therefore, you should choose your trading instruments. Only after evaluating each of them, weighing all the pros and cons, can you understand which ones suit your purposes.
You may also like:
How to choose a broker for Forex trading
Best monitors for stock trading


