


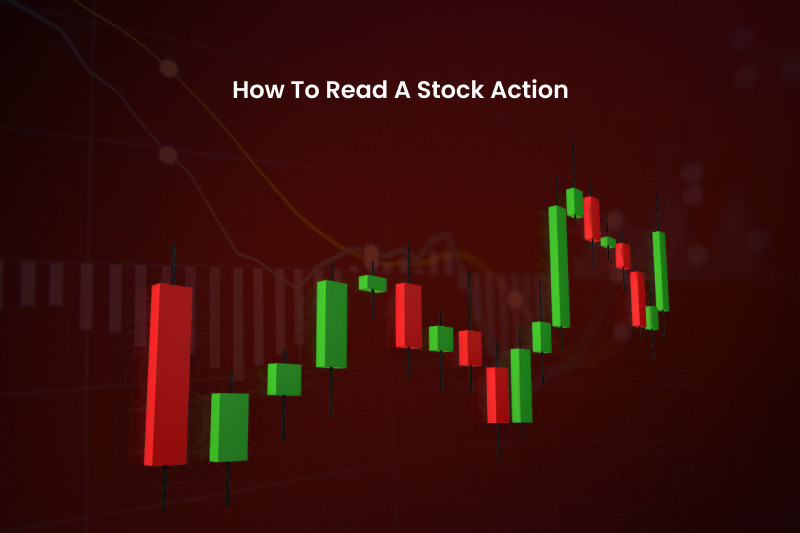
Equities can be used not only for investing but also trading and yielding a profit intraday.
In order to succeed in stock trading, a person should know how to read price charts. That is what this article is about.
If you want to learn more about charts of other trading instruments, you can read the article “Trading charts.”
About stock market
A stock market is a place where stocks and other equities are traded. Stock exchanges make up the stock market.
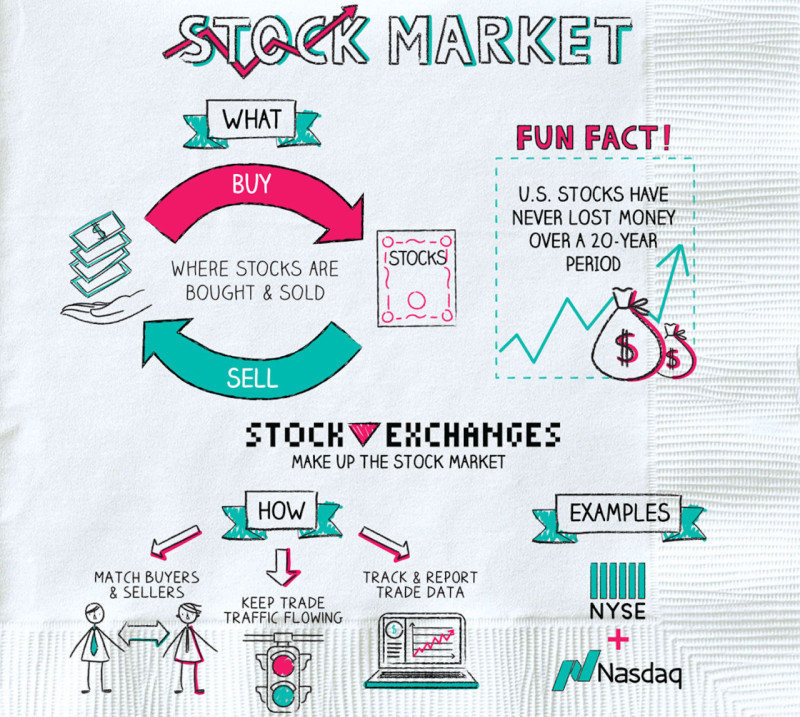
Although exchanges are situated in different countries, they can be accessed from anywhere in the world via the Internet. Modern technologies have made trading available directly from home.
At the same time, only legal entities can make transactions on exchanges. Private investors require an intermediary to carry out transactions on the stock market. As a rule, these are brokerage companies that make stock trading possible for them.
They make transactions on behalf of their clients and charge a commission for their services.
The main rule of trading in the stock market is to buy when the price goes up and sell when it goes down. However, if only that were so simple, all bidders would have been millionaires by now.
In fact, trading has nothing to do with gambling. Here you rely on the knowledge, experience, and accurate calculation. Stock trading has never been about luck.
In order to determine the right moments for opening and closing transactions, traders should have basic knowledge of economics, finance, and stock trading.
They can search for information on the Internet, take online training, etc. Anyway, they choose the most appropriate option for them.
Next, they pick a brokerage company. In fact, that is a very responsible step as there are many scammers and fraudsters in the market itching to steal traders’ funds.
An intermediary firm must have a license and be regulated. In order to select the most suitable partnership, it is important to compare the conditions of different brokers.
How to read a stock action, before trading in the stock market, traders try their hand at a demo account. This is an additional step of training because trading is carried out with virtual rather than real funds. That is a way to acquire some practice and not theoretical skills.
Financial instruments traded in stock market
Stock and bonds are the main financial instruments traded in the stock market. Stocks are considered to be a higher-risk and more profitable asset, while bonds are less risky and with a lower yield.
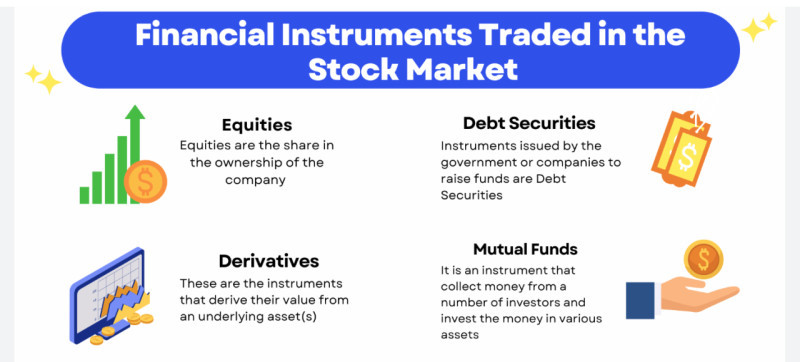
In the stock market, traders are primarily interested in equities because fluctuations in their value can be profitable.
By purchasing equities, traders acquire a stake in the issuing company. Their share is often too small to actually participate in the governance of the firm. However, with any number of equities, they are qualified for dividend payments.
A debt security is a debt obligation of a company or government to those who acquire them. Here the issuer borrows money from the buyers of these securities with the obligation to return them with interest later.
Liquidity is one of the most important stock indicators. Stocks with high liquidity are in high demand. So, they can be sold at the price close to the market one at any time.
Highly liquid stocks are also called "blue chips." These are often equities of large corporations. Although they are usually quite expensive, they are always a good investment option.
Stocks with low liquidity are less popular and often undervalued. As a rule, they are bought by more experienced users who know how to analyze them right and assess their growth potential in the market.
In addition, in order to enter the equity market, traders should have considerable amounts of money. The required initial deposit is usually at least $5,000. Otherwise, changes in the value of assets will not bring the desired profit.
When it comes to trading derivatives, such as CFDs, they do not require large investments.
Equity trading
Trading in the equity market is believed to be easier than in the forex market. The thing is that the stock market is more predictable and is influenced by macro- and microeconomic factors.
Behind each equity, there is an issuing company, whose data and financial indicators are publicly available. Each trader can read and analyze them before making trading decisions.
In addition, there are analysis forecasts and company news that may shape the price of equities. For every industry, there are risk factors and growth drivers such as the launch of a new product, patents, upbeat financial statements, and so on.
How to read a stock action, traders rely on these data to choose assets for investment. For them, it is important to buy an asset lower and sell it higher. Therefore, trading is of two types: spot and futures.
Spot trading involves instantaneous transactions. That is, funds are immediately debited from the buyer's account, and the assets acquired are credited to it.
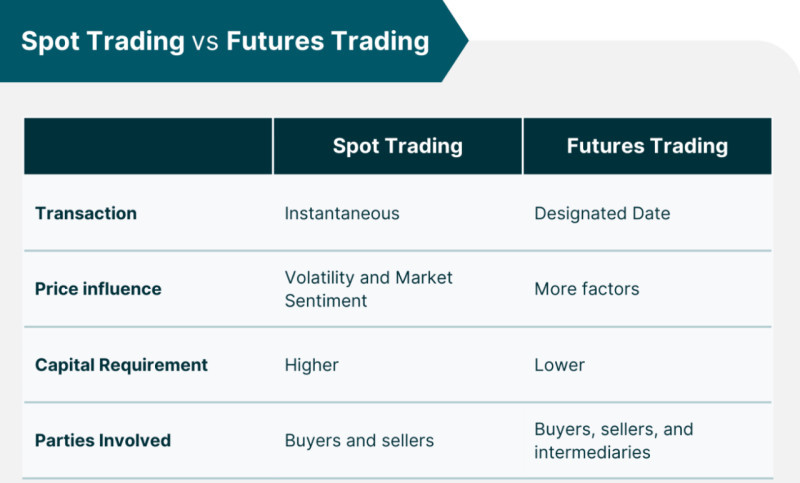
Money and assets are credited to the account within two business days. This time is required to make mutual settlements between the exchange, broker, and depository.
Futures trading involves a designated date for conducting transactions and is with derivative instruments.
Derivatives
Derivatives are trading instruments that can perform several functions for different market participants.
Hedging is one of these functions. That is the protection of traders’ assets from potential risks.
How to read a stock action, traders consider speculation on the value of an asset to be more interesting. If they want to make a transaction with derivatives, they do not have to pay the full price. They just pay an initial margin in the amount of 10-20% of the transaction amount.
That allows traders to purchase more derivatives than assets. The most important thing here is that risks increase along with potential profits.
Therefore, funds should be distributed in such a way that they are sufficient enough to cover the margin. Otherwise, the intermediary will forcibly close the position.
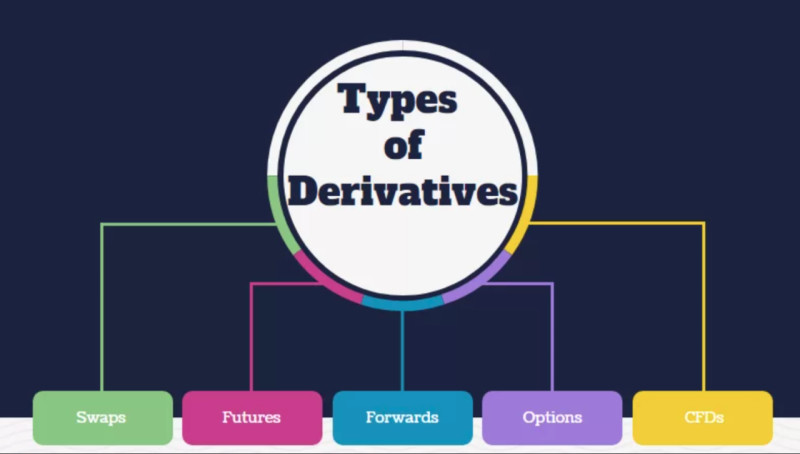
CFDs and futures are the most popular derivatives. Let’s now look at their primary features, similarities, and differences.
A futures contract is a legally binding agreement to buy or sell an underlining asset on a specific date and at a preset price. An important feature of this type of contract is that it makes both the seller and the buyer obliged to make a transaction in the future.
A contract for differences (CFD) is a tool for trading on a difference in prices. Trading CFDs is a way of speculating that does not require the buying and selling of any underlying assets but allows investors to trade the direction of assets.
How to read charts of stocks and derivatives
The charts of derivatives are akin to the charts of underlying assets. Therefore, for experienced traders, reading the charts of stocks and derivatives is a piece of cake.
Yet, these trading instruments have some peculiarities. Let’s take a futures contract as an example.
One of its features is that the number of agreements is constantly changing in comparison to equities, whose number is constant.
Factors such as high leverage, low fees, and low initial deposits make futures popular among investors. Consequently, the number of speculators in the market increases along with volatility.
The behavior of futures depends on their life cycle, which averages 9 to 13 months. Therefore, price data may not be objective enough at different times. Activity usually rises in the last 3 months.
At the same time, the chart of a futures contract and the chart of an underlying asset should both be analyzed. That will help traders get some leading data on the derivative, which has not yet
been displayed on its chart but is already illustrated on the chart of an underlying asset.
Given that the number of futures contracts is not constant, it is the number of open positions that should be taken into account. This indicator is always even because each transaction involves two contractors: the seller and the buyer.
As a rule, the more open positions there are, the more active trading gets. Consequently, demand for a particular futures contract will be more buoyant.
How to use CFD charts
CFDs are interesting because they allow you to earn both on an increase and a decrease in the price of an asset. That is their main feature. When shares go down in value, investors incur losses, and a CFD trader can profit from it.
The thing is that when the value starts to decline, selling equities does not make sense, as investors will lose their money. When trading CFDs, a profit can also be made on a decrease in the value of assets.
In general, even when the market collapses and investors lose their investments, CFDs can still bring a profit. That becomes possible when the equity price of individual companies as well as of stock indices go down.
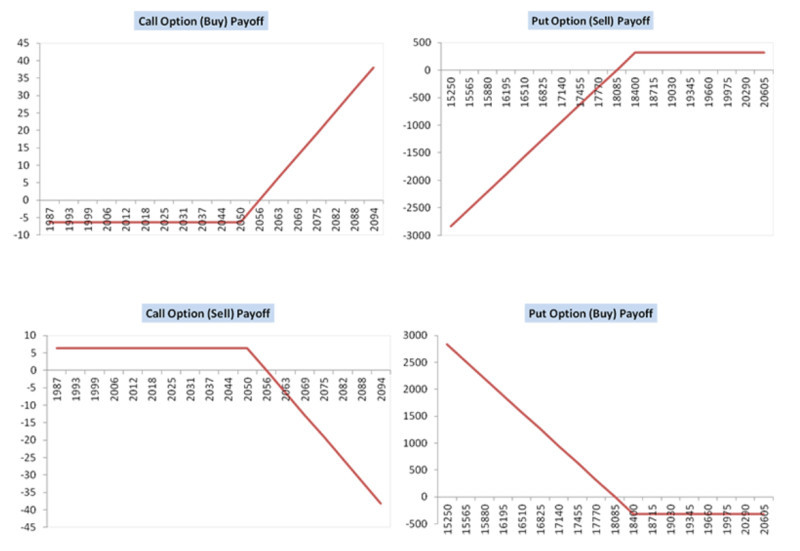
For analysis, CFD traders use the price charts of underlying assets. With the help of these charts, they can predict whether the value of those assets will rise or drop.
When quotes are expected to increase, traders open long positions (buy). They also place stop orders in case the price goes in the opposite direction. Consequently, when traders anticipate that the price of an asset will go down, they open short positions (sell).
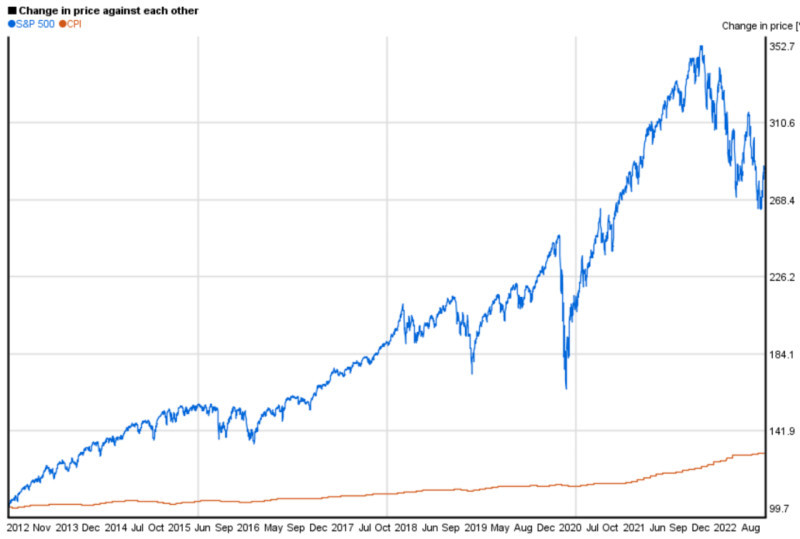
In addition to the charts of trading instruments, the charts of stock indices, such as the S&P 500, FTSE 100, Nikkei 225, and so on, can be analyzed. Oftentimes, trends on those charts illustrate the situation in individual companies included in the index.
Final thoughts
This article “How to read a stock action” is about how you can not only invest in equities but also trade them. That could be quite difficult to do by quickly buying and selling equities. Moreover, not everyone has access to it.
Individuals do not have access to stock exchanges. In order to trade in the equity market, private traders and investors should find an intermediary. As a rule, these are brokerage companies that make transactions on behalf of their clients on stock exchanges.
For their services, brokers usually charge commissions. The choice of an intermediary must be taken seriously so as not to fall prey to scammers.
In addition, not all stocks are suitable for trading. You can earn on fluctuations in the value of highly liquid assets only, as they are in great demand and easy to sell.
Still, there are more accessible and widely used trading instruments. They are derivatives such as CFDs, futures, etc.
They have a number of features and differences from each other. Still, in essence, they are used for making money on changes in the value of assets as well as on fluctuations.
In order to profit from trading derivatives, traders must know how to read and analyze stock charts.
You may also like
How to read stock charts
How to read investment charts
How to read graphs
Best indicators for 1 minute chart
How to read a candlesticks chart
Japanese candlestick chart
Candlestick chart


