


Trading on all financial markets without exception is impossible without charts. They visually reflect the market situation and show how the price of the asset changed over a selected period.
You can learn more about the different charts in the article Trading charts.
Many traders use indicators to make the analysis of charts easier. This is the main topic of our review.
This article will tell you about the best indicators for the best indicators for 1-minute chart. Read what this time frame is used for, what algorithms can be used in the trading, and what are the risks associated with M1.
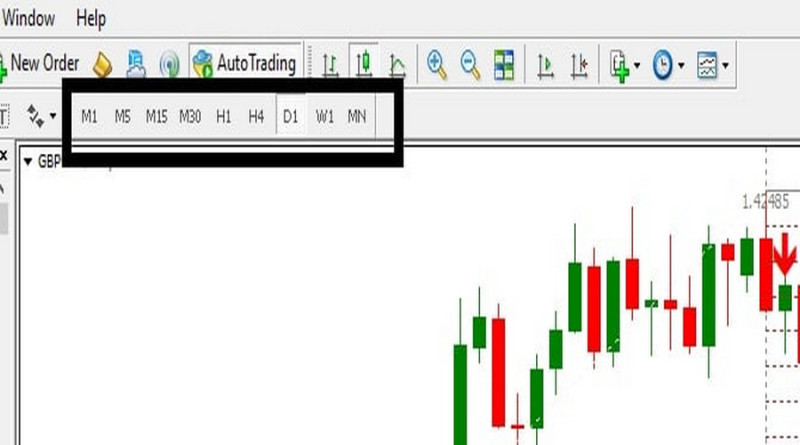
Features of M1 time frame
Before we get to indicators, let's focus on the concept of "1-minute chart." Simply put, it is a chart of the asset’s value within the M1 time frame.
This is the lowest time frame in trading.
How is it built?
Every minute a new element appears on the best indicators for 1-minute chart. If we are talking about a bar chart, then a bar is formed every minute. When it comes to a candlestick chart, a new candlestick appears every minute. In the case of a line chart, a new data point.
The 1-minute time frame is highly dynamic. There is a lot of market noise because the price is influenced by a variety of factors.
The most important ones are:
- news background: after the publication of economic or financial news, the price can move contrary to the principles of technical analysis on the M1. The price level may suddenly drop or surge, reversing in the opposite direction;
- market-makers: when big traders appear in the market, the volatility rises, and the risk of reversal increases. Contrary to higher time frames, the influence of whales is not smoothed out on the M1 time frame;
- time of trades: as a rule, volatility decreases at night. This is seen on the minute chart.
Even when the market is moving sideways, the price shows wide fluctuations on the M1 time frame.
Features of trading on the 1-minute chart:
- Microtrends are formed throughout the trading session. This occurs even when the market is flat on higher time frames;
- The price is very sensitive to fundamental factors. It can sharply rise or fall on the background of economic or political news;
- Usually, it takes several minutes to make a single trade. Longer-term positions on M1 are rarely taken;
- The situation changes very quickly, which requires traders to make trading decisions quickly;
- Dozens of trades can be made during the day. Usually, they are small in volume, but they can bring a large number of the total profits.
Considering all the above, we can conclude that the M1 time frame is not suitable for beginners. Firstly, high-tempo trading assumes a lot of transactions. Sometimes, traders are exhausted when trading at such a pace, and novice traders are unlikely to keep up with it.
Secondly, traders may lack the practical skills and knowledge to quickly react to the constantly changing market situation. This is why beginners most often lose their deposits on the 1-minute chart.
There can be two scenarios:
- Traders lose control of the situation and miss all trading opportunities;
- On the contrary, traders begin to make a lot of losing trades. If he takes a loss, he tries to win back, seeing trading opportunities where there are none.
Pros and cons of the M1 time frame
| + | - |
|
|
Despite all the disadvantages, the M1 chart is very popular. Most often, they are used by scalpers who make fast and frequent transactions.
In addition, the 1-minute time frame is used by medium-term and long-term traders, when they want to detail working charts, that is, charts of a large scale.
How to apply indicators to M1
It was mentioned earlier that the best indicators for 1-minute chart is very fast. Behind a small price movement on the hourly period, there will be a lot of fluctuations, which are noticeable only on the minute chart.
With this in mind, a trader should not use a large number of indicators in trading. The optimal solution is to choose two or three of the most reliable indicators.
The thing is that if there are more of them, you may get confused with their signals and miss a trading opportunity. On the 1-minute chart, timely action is more important than on any other chart.
Functions of indicators:
- Scan the market;
- Forecast asset’s price;
- Evaluate the market situation.
Visually, indicators may be located below the value chart or may be superimposed directly on the chart. Each algorithm has its purpose, as well as pros and cons.
The variety of indicators that can be used on the 1-minute chart can be divided into three types:
- trend, which helps to identify the vector of price change as well as its potential;
- oscillators, which are used during flat periods and identify overbought or oversold conditions;
- level, which uses a linear chart layout and allows you to make a profit when using support and resistance levels.
As for the candlestick pattern indicators, they are rarely used on lower time frames. The point is that they require a thorough check of signals, and scalpers have very limited time for such analysis.
Recommendations for the use of indicators on the M1 chart:
- Different indicators can be applied but try to use no more than three of them. Otherwise, the chart will be overloaded, there will be contradictory data and you simply will not have time to check them;
- It is necessary to use indicators of different types at the same time. There is no point in using two trend algorithms or as many oscillators. It is better to use one of each type;
- No algorithm can guarantee a profitable trade. It helps to determine the trend, to build a forecast, but it is up to a trader to make trading decisions.
Thus, on the 1-minute chart, you can apply the same algorithms that are used on higher time frames. The main thing is to adjust them to the pace of M1.
Top 10 indicators for M1 time frame
Now let's talk about some indicators for M1 charts, which are used by many market participants and have proven their effectiveness.
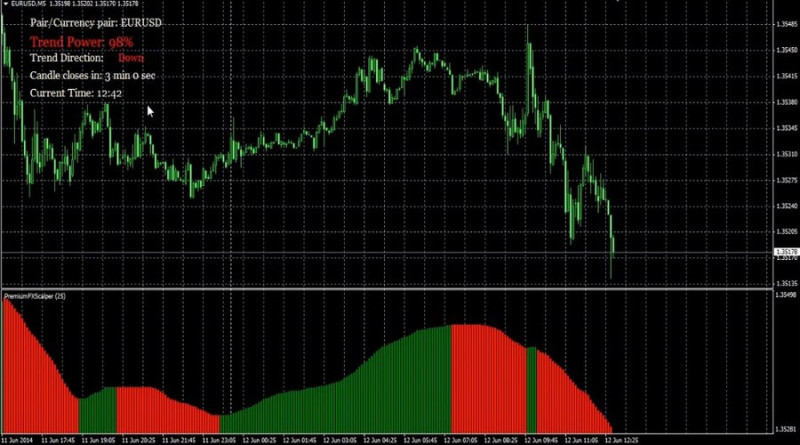
1. Scalper Dream. This indicator was developed specifically for scalping. It is not included in the standard set of trading platforms, so to use Scalper Dream you should download it and then upload files to the trading platform.
It is most often used when trading currency pairs. Its main purpose is to find the moments of asset price reversal and inform the user about it.
Visually, it is represented by a set of green and red bars, following each other and located under the chart. When the algorithm finds a market reversal in the direction of buying, the color of the bars is green, when the price turns in the direction of selling, the indicator shows red bars.
The signal for entry is a change in the coloring of the bars. If the red columns were replaced by green ones, it means that the price went upward and a buy position is advisable.
On the contrary, if green bars come after red ones, it means that it is necessary to sell the asset because its price is going down. An important nuance is that it is necessary to enter the market only at the moments of reversals (in two candlesticks to filter the noise).
If the chart shows a lot of consecutive bars of the same color, it means that it would be better to postpone the trades.
Positions are closed after the bars have changed color once again. The algorithm is not redrawn, that is, the color of its elements does not change over time.
Scalper Dream also has an additional information panel, which is located in the upper left corner of the chart. The most important information about the market situation is presented there: the direction of quotes, the strength of the trend, etc.
The strength of the trend should also be taken into account when making an entry. It is recommended to open a position when this indicator exceeds 65%.
That is, the strength of the trend, in this case, is a kind of filter of data coming from the indicator.
As for Stop Loss and Take Profit orders, indicated in the information panel, they are advisory and can be adjusted.
Together with Scalper Dream experts recommend using Support and Resistance levels, patterns, etc.
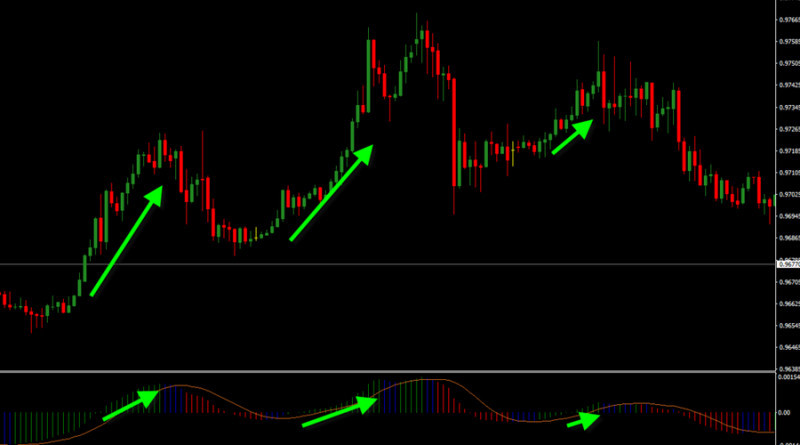
2. MACD Color - this indicator for the 1-minute chart belongs to the group of trend oscillators. It is a more advanced version of the classic MACD.
It consists of a multi-colored chart and two moving averages. When the latter cross, the trader can open a position.
Now, let's talk about the colors of the chart in more detail because it is the variety of colors that distinguishes it from the standard MACD.
Depending on the color, there are several variants of the indicator. For example, the MAX tool contains bars of three colors: red, green, and blue.
The first one indicates a decrease in the value of the asset, the second one indicates an increase in the price, and the third one indicates a correction, i.e. a flat.
Accordingly, when blue bars appear, they can be interpreted as a signal of an upcoming reversal.
If they appear after the red bars, it is better to buy the asset, if after the green ones, sell. As a rule, positions are opened after three blue bars.
There is also a variant of the indicator whose chart has four colors. For example, light green means a bullish trend and dark green means a correction.
Two shades of red represent the same.
When using this indicator on the 1-minute chart, it is important to pay attention to the placement of the columns relative to the zero level. It means that the strength of bulls and bears is at the same level.
Accordingly, if the chart goes below this mark, it means that sellers are controlling the market. This may indicate the beginning of a downtrend.
When the bars rise above zero, it means that the market is under the control of buyers, who push the price higher;
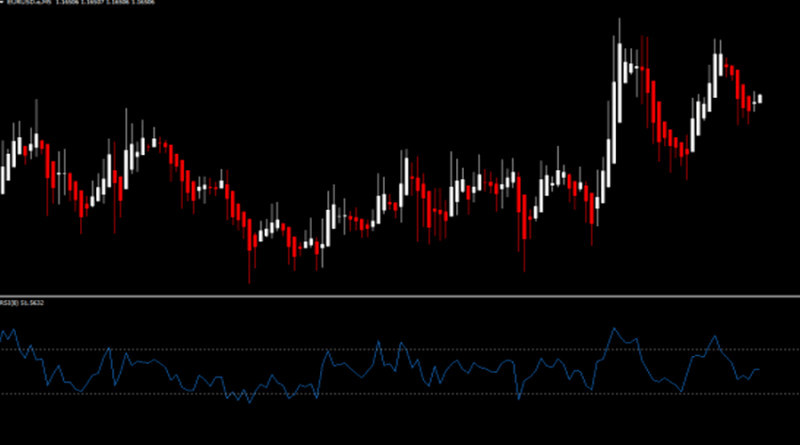
3. The Relative Strength Index is another indicator that can be used on a variety of charts, including the 1-minute one. This is an oscillator, which is used when trading currency pairs, cryptocurrencies, and other assets.
It is located below the chart and represents a curve. It is possible to judge whether an asset is oversold or overbought by the location of the line relative to its key levels.
For instance, if the line rises above 70, the asset is overbought. In this case, it is better to open a short position, as the price may change its direction.
The opposite is true when the RSI falls below 30. The asset is likely to be oversold and a trader should place a buy order.
If the curve fluctuates near 50, there is no clear trend in the market. In this case, you may have a break in trading;
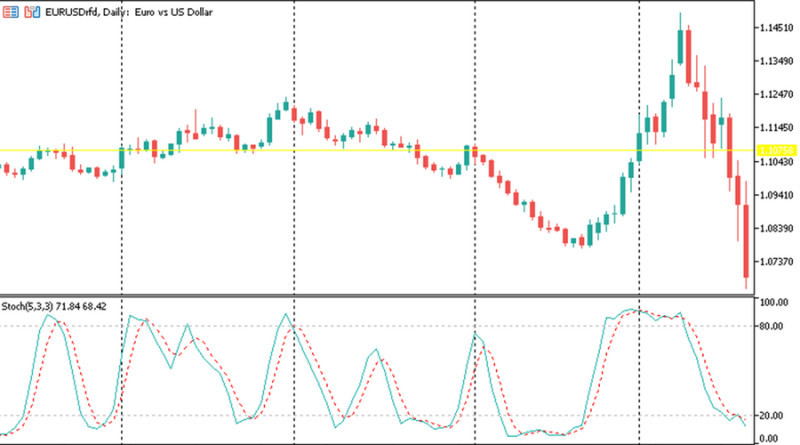
4. Stochastic is an oscillator that detects momentums on the chart. You can use it to find optimal entry points when the main trend changes.
According to George Lane, the creator of this indicator, when the price of an asset increases, this process slows down at a certain point. When it decreases sharply, the price changes its direction. Thus, the asset becomes cheaper.
The point where a reverse in the price’s direction occurs is called momentum.
In a mathematical sense, the stochastic oscillator demonstrates the ratio of the Open/Close value and the difference of extremums for the selected time, calculated as a percentage.
Visually, the stochastic oscillator is comprised of two lines: solid K% and dashed D% lines. Their colors can be set in the settings.
The first line is built using the formula described above. The second one is formed by smoothing K% using the moving average.
In other words, K% is faster and more significant, while D% is slower and performs a signal function.
When K% exceeds 80, it means that the Close value is near the upper boundary of the range, if it is below 20 - near the lower boundary. In the first case, we can talk about an uptrend, and in the second - a downtrend.
These levels show the overbought and oversold areas, if the price goes beyond these limits, a trend reversal is possible. It means that if the K% line moves below 80%, one may open a short position.
When the main line goes above 20%, it is better to buy an asset.
Signals can also be obtained when the K% and D% lines intersect. When the first one crosses the second one from below, you should open a long position, when the intersection happened from above, you can open a short position.
At the same time, the most important and reliable signal of the Stochastic Oscillator is divergence. In this case, the indicator lines and the price begin to move in different directions.
For example, when the price goes up but the indicator declines, it is a bearish divergence. The trader in such a situation can sell an asset.
When the picture is opposite, it is appropriate to buy.
The Stochastic Oscillator is similar to the Relative Strength Index in many ways, and they can be used together to smooth market noise;
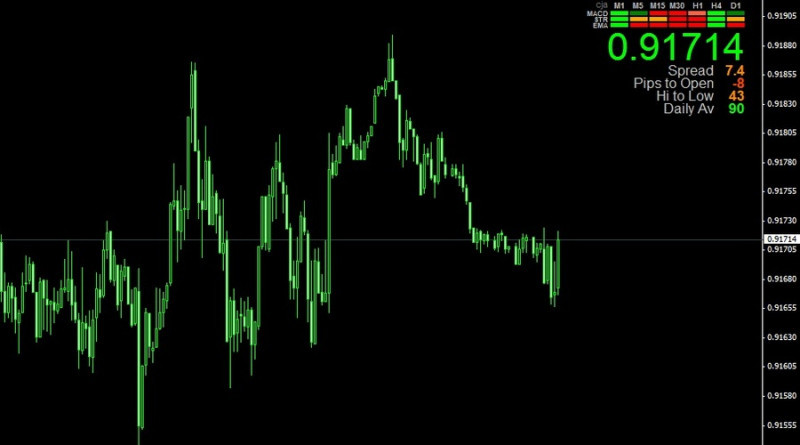
5. Signals Bar is a trend indicator. It determines the changes in the quotations and signals about the upcoming trend reversal.
It has three components: EMA, MACD, and STR. Their data is contained in the indicator table, which is usually located in the corner of the chart.
What the colors of cells mean:
- red: formation of a bearish trend gives a sell signal;
- light green: bullish trend development, the asset may be bought;
- orange: if it refers to the MACD, it means that the uptrend is getting exhausted. It is better to close buy orders;
- orange: if it refers to STR: sideways trading. In this situation, it is better to refrain from opening positions;
- dark green: an appearance in the MACD box indicates a weakening downtrend. In this case, it is better to close Sell orders.
The information is presented for different time frames from M1 to D1. To confirm the signals on the 1-minute chart, it is necessary to check them on a higher time frame. In this case, the colors should coincide.
If the colors are different, it is better to postpone entering the market;
6. Scalper Signal is a signal indicator that was created primarily for scalping. Each arrow indicates the optimal point to enter at the moment of a trend reversal.
Red arrows give a sell signal, and green arrows give a buy signal.
If you trade on the M1 time frame, it is important to set a high level of signal filtering. This can be done in the Scalper Signal settings, setting the value of 1 or 2;
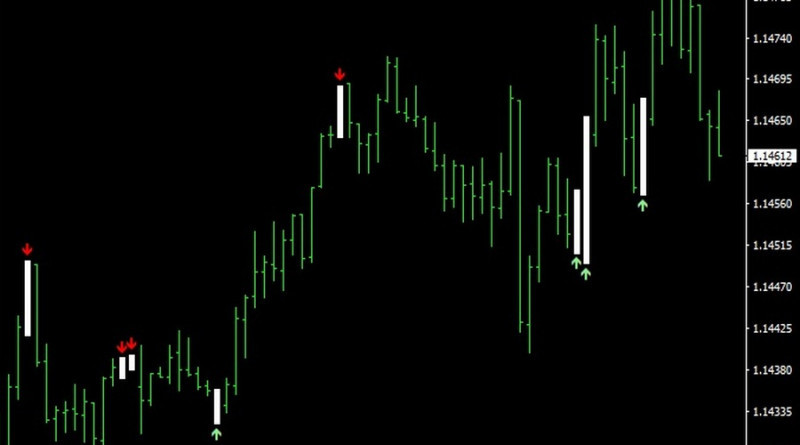
7. Bar Value is an indicator that finds extremely long candlesticks or bars on the chart. As soon as it finds one, it immediately notifies a trader.
Bar Value is based on the principle that large candlesticks and bars are signs of a trend reversal.
Bullish elements are accompanied by green numbers denoting the height, and bearish ones - by red numbers. Using the settings, the value can be set as a percentage of the previous elements or in pips;
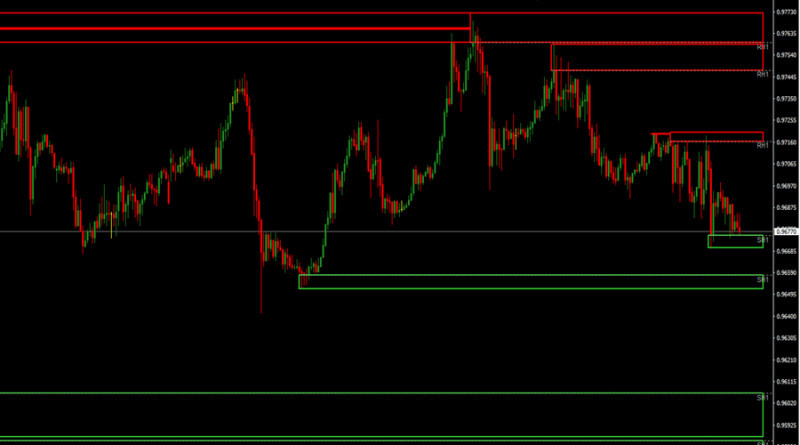
8. Zone is an indicator that draws the Support and Resistance levels on the chart. The settings of this indicator are very simple: just set the time frame (in our case - M1) and set the number of elements (candlesticks, bars), by which the Support and Resistance lines will be drawn.
The support level on the chart is green and the resistance level is red. When the lines are fixed, one can trade either on a bounce or a breakout.
In any case, the Support and Resistance zones can be reference points to place Stop Loss and Take Profit orders.
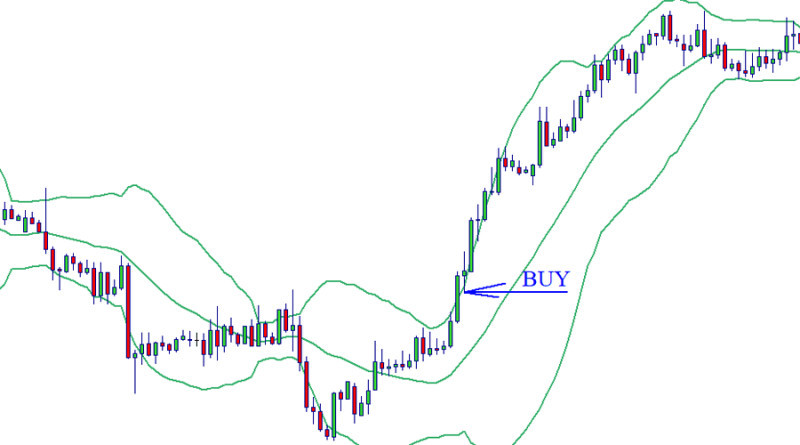
9. Bollinger Bands is a tool for measuring volatility, which consists of three SMAs. The outermost ones are the borders of the channel within which the price moves.
When the price is near the upper line, the asset is overbought. If it is near the lower line, the asset is oversold. The width of the channel indicates the level of volatility: the wider the channel, the higher the volatility.
When the price reaches the upper line, the indicator gives a buy signal. On the contrary, when it touches the lower line, the asset can be sold.
In the first case, the middle line will serve as Support, and in the second case, it offers a Resistance level;
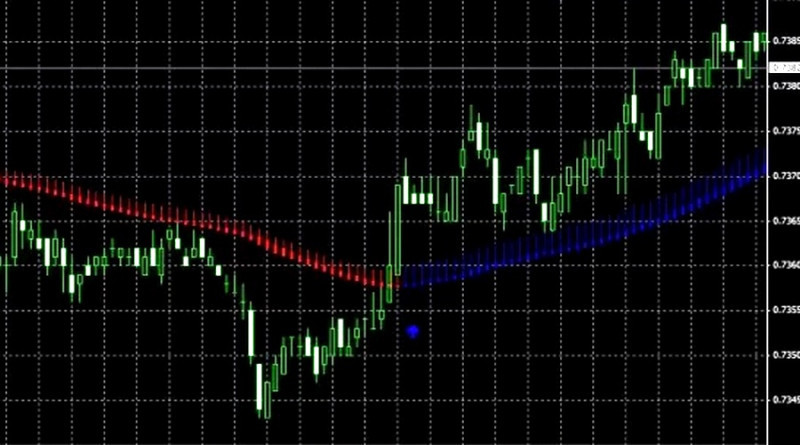
10. Scalper MA is an indicator based on the Moving Average. It is classified as a signal and is used to determine the trend.
The vertical strokes that make up the line of the algorithm reflect the direction of the price. When they are red and the Scalper MA curve is moving downward, it means that the price is decreasing.
The line consisting of blue bars appears during uptrends.
The indicator signals are represented by arrows. If they have an upward direction, one can buy the asset and sell it, if otherwise is true.
All of the indicators are the best for the 1-minute chart. You can use them when trading on MetaTrader.
Some are built into MT4 and MT5 by default, and some of them need to be downloaded and added to the trading platform.
Features of trading on M1
The 1-minute chart is one of the most difficult for trading. The fact is that due to its specifics, there are great risks of losing the deposit, especially for beginners.
Peculiarities of trading on the 1-minute chart:
- Traders need to constantly monitor the market situation and be prepared for excessive market noise;
- Trading decisions on the entry should be made promptly;
- It is important to keep open orders under control all the time. Sometimes there can be about 10 of them at the same time, so traders have to be very attentive and focused;
- It is better to use as minimum tools as possible for technical analysis. The optimal number of indicators is two. The first one finds the point for opening positions, and the second one filters the signal coming from the first algorithm.
Beginners use the 1-minute time frame because it allows them to make a quick profit in a short time. The ability to make quick profits when scalping is one of the advantages.
In addition, scalpers usually do not trade large amounts. They make many transactions during the day but each of them is characterized by a small volume.
This means that even a loss is not very big.
At the same time, traders experience significant psychological pressure when making fast and frequent trades. This is another factor to consider when using the 1-minute chart.
Trading decisions in the process of trading need to be made instantly, there is often not enough time for analysis and reflection. When making a losing trade, the trader subsequently makes attempts to win back losses.
As a result, emotions get out of control and trading becomes gambling, which usually does not lead to anything good. Meanwhile, do not think that scalping on M1 is only about losses and frustrations.
Many scalpers earn hefty sums. The main thing is to develop an effective trading strategy, stick to it when making trades, and keep emotions under control.
Reasons why traders use scalping on M1:
- Swaps do not matter;
- Transactions are fast, there is no need to wait long for the result;
- During the trading session, you can make many trades, thereby increasing the amount of money on the deposit;
- Trading signals appear frequently, which opens a lot of trading opportunities.
Risks associated with the use of the 1-minute chart in trading:
- Emotional tension, the need to always be alert;
- The abundance of market noise can affect your trading decisions;
- Beginners should react quickly to signals.
What strategies to use on M1
Today, many strategies can be implemented on the 1-minute chart. Let us describe some of them.
1. The strategy that involves using the Moving Average. It is based on using the moving average crossover points as signals for entry.
You should use two EMAs. One should have a period of 21 bars and a period of 15 bars for another. For your convenience, you can set different colors for these two curves.
As it was mentioned earlier, the signal to open a position will be a crossover of the EMA. Its direction should be opposite to the previous trend.
If the trend is upward, you should open a short position, if it is downward, you should open a long position. You should enter the market only when the bar, on which the MAs have crossed each other, has been completed;
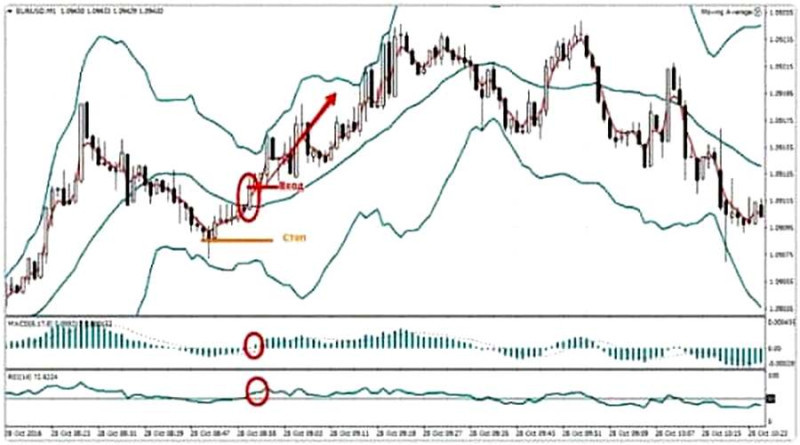
The strategy is based on MACD and RSI signals. In this case, Bollinger Bands are used for outlining the price range.
Periods to be set in the settings:
- EMA - 3. This indicator shows the direction of price changes;
- Relative Strength Index - 14;
- Bollinger Bands - 20;
- MACD - 6, 17, and 8.
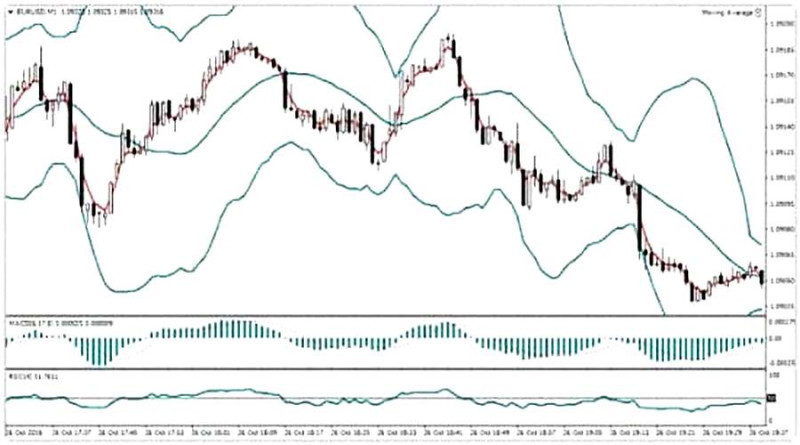
The Moving Average and Bollinger Bands are used as tools to determine optimal entry points. Other indicators perform an auxiliary function and filter the signals of the first two.
It is allowed to open a position only when the signal bar has closed. The important nuance is that the closing should take place above the price channel, if long positions are meant, and below it if we are talking about short positions.
Indicators for opening a short position:
- The EMA breaks through the middle line of the price channel formed by the Bollinger Bands and continues to move down. This indicates that a bearish trend has formed;
- The MACD is below the zero level;
- The RSI has crossed the level of 50 and is moving above it.
Conditions to be met for the opening of long positions:
- the EMA crosses the central Bollinger Band and increases to the upper band;
- all of the MACD bars are above zero;
- the RSI is above 50, which confirms the bullish trend.
One should remember that if at least one of the above conditions is not met, it is better to refrain from trading.
Now let's move on to stop loss and take profit orders.
There are several options for setting a stop loss order. For instance, a stop loss can be set at two or three points away from an extremum or on the opposite side of the price range formed by the Bollinger Bands.
When trading, these options can be used depending on the specific position.
As for take profit orders, it is recommended to place them between four and eight pips away from the boundary of the price channel.
The experience shows that it is better to apply it during intraday trading when volatility is high. In this case, there is a high probability of getting maximum profits. At the same time, traders have to be constantly on alert because of the frequent signals.
It is better to avoid opening positions before the breaks in trading and immediately after their completion. If we are talking about Forex, we mean weekends, if we are talking about the stock exchanges, these are breaks between trading sessions;
3. Trading on a breakout of the price range. This strategy is best used when the market is calm and when the risk of momentum is minimal.
So, if we are talking about Forex, which operates 24/5, then it is possible to choose the evening or nighttime for trading.
As the name of the strategy suggests, level indicators should be used. For example, Zone, which we have already talked about in this article.
A trader opens positions after the Support or Resistance breakthrough and according to its direction.
It is important to pay attention to the fact that the range is not very wide. If we are talking about a Forex currency pair, the price should vary by a maximum of 10 points.
To make sure that a signal is not false, it is necessary to check the reliability of the trend. On M1, the price range should remain at least 50 candlesticks or bars.
It is better to set stop loss orders outside of the range.
Regardless of the strategy a trader chooses on the 1-minute chart, certain recommendations should be followed in trading. Here are some of the most important ones:
1. It is not advisable to use a large number of assets for trading. For example, it is better to make simultaneous transactions on two or three currency pairs on Forex.
If there are more assets, the abundance of charts may confuse traders and will not allow them to keep track of all the changes;
2. If there are several losing trades in a row, trading should be paused. The break should last at least an hour. During this time, a trader will be able to calm down emotions and take control of the situation;
3. On the 1-minute time frame, it is recommended to trade only according to the main trend. Trading against the trend is very risky and can lead to financial losses;
4. The trend formed on M1, is important to be checked on the higher time frames. For example, you can use M15 or M30;
5. It is not necessary to overload the chart with indicators. Especially if we are talking about algorithms that are displayed directly on the price chart.
Conclusion
In this review, you have learned about the best indicators for the best indicators for 1-minute chart. This time frame is most often used in scalping, so it is not recommended to use more than three indicators simultaneously.
Their main function is to generate trading signals. Signal (arrow) algorithms are best suited for this purpose.
They will select the best point to enter and indicate the direction of the trade. In addition, some indicators will even advise on where to place stop loss and take profit orders.
However, it is necessary to use other types of indicators along with the signal ones: trend indicators, level indicators, and oscillators. The fact is that no matter how accurate the algorithm is, the probability of a false signal will always be there.
Using several options (main and filtering), signals can be rechecked, and possible risks can be minimized.
You may also like
How to read stock charts
How to read investment charts
How to read a stock action
How to read graphs
How to read a candlesticks chart
Japanese candlestick chart
Candlestick chart


