


Price Action is one of the most effective strategies commonly used by traders.
This article is about how the Japanese candlestick chart is analyzed by software and what you should do to identify patterns yourself.
Meanwhile, the article “Trading charts” will tell you more about other charts, their usage, and how to choose one.
Possible chart options
If you are a trader, you may have noticed that trading platforms mostly offer charts. Traders usually have access to three chart types at least. These are line, bar, and candlestick charts.
Line charts use line graphs. They are based on the price of an asset, usually the Close Price.
The program places points corresponding to the Close Price and then draws a line between them. The trader does not know about periodic fluctuations because line charts never provide such information.
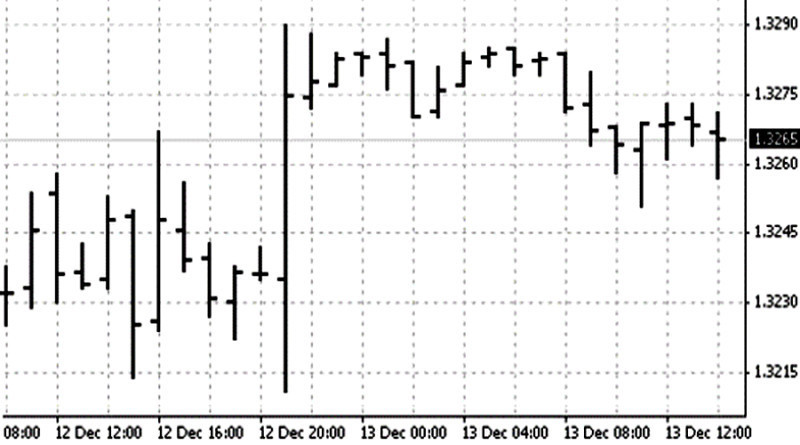
Unlike line charts, bar charts are more informative. They can be of four types — two extreme points, the Open Price, and the Close Price.
It may seem that the trader has all the necessary data for analysis. Yet, the bar chart may be of little help when analyzing, especially for beginners.
The user will see many vertical lines (most often of the same color) with horizontal strokes. Assessing trends and finding patterns will take not only time, but skills developed through practice.
That is why many experts believe that the JC chart is the best option for analysis. It is the most informative chart, which makes it very popular among traders.
With its help, you can not only determine price movements but also understand market sentiment.
Some facts about Japanese candlesticks
Japanese candlesticks are used in trading longer than lines and bars. They came along in the 18th century in Japan. That is why they are called Japanese.
Homma Munehisa, a rice merchant from Japan, is considered to be the father of candlesticks.
Although he had enough income for a comfortable life, he wanted to earn even more. So, he began to trade in a rice exchange.
This is where he gained his skills and trading experience. Having access to the price history of rise on this exchange, Homma Munehisa found certain price patterns and recorded all the results.
Later, he moved to the city but did not stop doing analysis. He then became a financial advisor and even wrote a book on the basics of technical analysis.
To perform analyses, Munehisa used four indicators of the price of rice: Open, Close, high, and low.
He illustrated these data as graphic elements, which later became Japanese candlesticks.
To get the latest information about the price, he used signals from the so-called “intermediaries.” They were people on the watch near ports, located miles away from the exchange, who inquired about rice prices when merchants arrived.
In other words, when rice was still on the way, Munehisa already knew its price. So, he quickly built graphic images which reflected the price dynamic.
Japanese candlesticks came to Europe and the United States in the late 1980s. They were introduced by analyst Steve Nison and quickly became popular among traders across the world.
Data used in trading
A candlestick chart is a set of elements located one after another and tied to a timeline. That is, each new Japanese candlestick appears when a certain period of time set by the user ends.
For instance, in the 1-hour time frame, new elements will appear every hour. All the information they contain will be about this particular period of time.
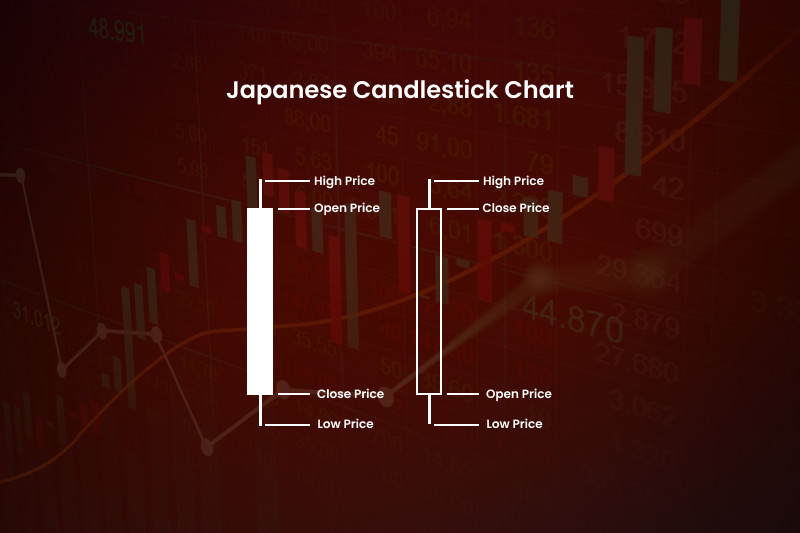
If we take a particular element on the chart, it will show us the following data:
- Open Price
- Close Price
- High Price
- Low Price
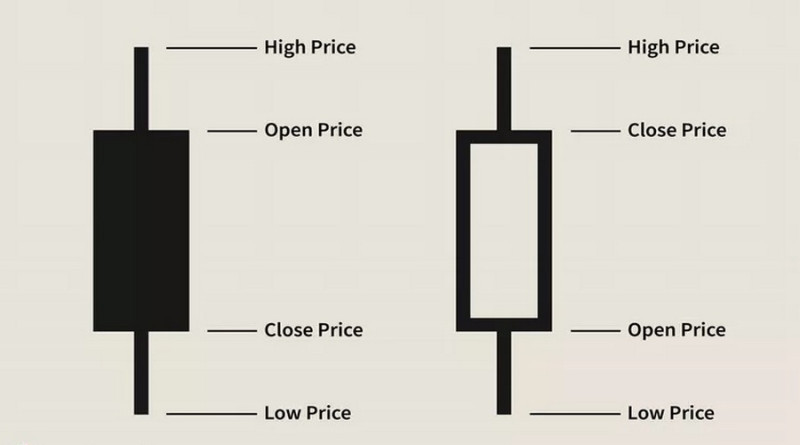
The gap between the first two indicators is the body of the Japanese candlestick. Depending on the price range, the body can have a shape of a square, rectangle, or horizontal stroke.
If the price is on the rise from the Open Price to the Close Price, we have a bullish Japanese candlestick. It is usually colored green or white on the chart.
Conversely, if the price moves down from the Open Price to the Close Price, it is a bearish Japanese candlestick. It is colored black or red on the chart.
Extreme points are the tops of shadows, which are also often called wicks. The High Price is located at the top of the upper shadow and the Low Price is at the top of the lower shadow.
Thus, Japanese candlesticks reflect the sentiment of buyers and sellers, helping to understand their doubts and analyze their activities.
A savvy trader can see the current sentiment, price dynamic, and impending reversals by simply looking at the chart. Meanwhile, with bar charts, quick analysis is not an option.
How software analyzes Japanese candlesticks
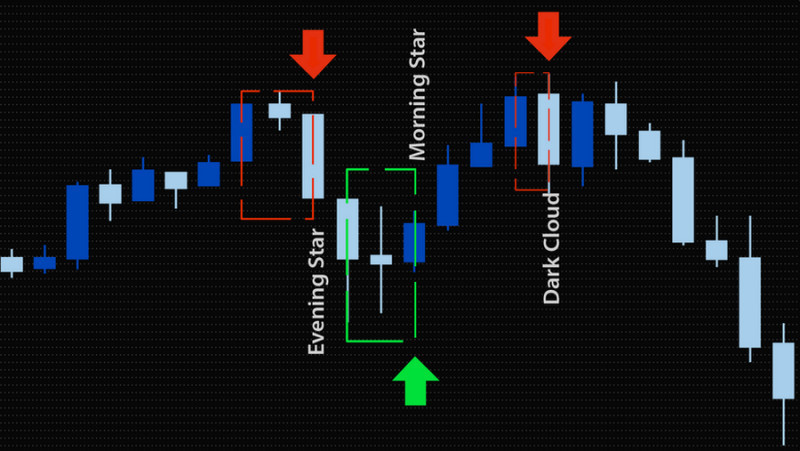
Analysis of candlestick charts involves identifying patterns that help make forecasts for the future. Such patterns are in abundance, with some of them suggesting upcoming reversals and others reflecting trend continuations.
Examples of reversal patterns:
- Hammer and its various variants
- Engulfing
- Dark Cloud Cover and Piercing
- Harami
- Three White Soldiers and Three Black Crows
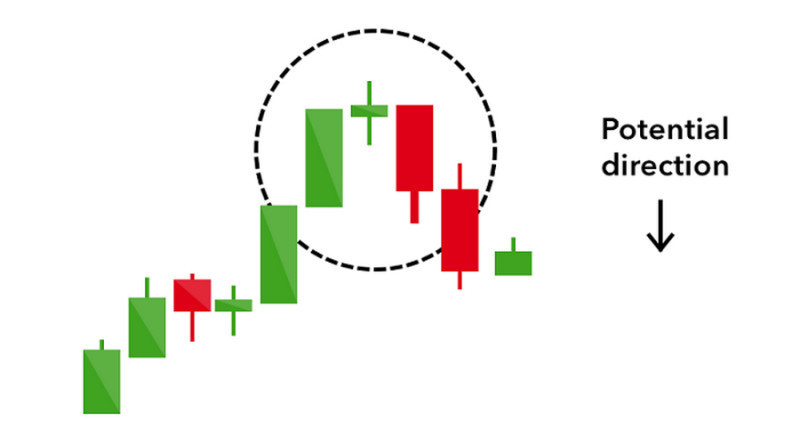
You can find the Evening Star pattern in the image below. It consists of three Japanese candlesticks and appears when there is a bull trend.
This is a reversal pattern, which implies that we sell after its formation.
Examples of trend continuation patterns:
- Marubozu
- Mat Hold
- Thrusting Line
It will take time to memorize and learn to analyze even the common Japanese patterns. However, even if all the conditions are met, a subjective factor is still possible.
For instance, traders may see different patterns or non at all on the same chart.
To avoid such a possibility when doing your analysis, you can use special software.
Here we talk about indicators. They will identify patterns and you will use those signals to open trades.
The use of indicators will help you to:
- save time and strength. You will not have to monitor the chart for Japanese candlesticks, reversals, and trend continuations;
- increase trading efficiency. Patterns will show you when is the best time to enter the market, and your trading results depend on that;
- develop trading skills. When analyzing formations found by indicators on charts, you learn how to see those patterns yourself.
To see how traders use indicators in their work, let’s take one of the most popular software – the Candlestick Pattern Indicator.
It can find over 30 Japanese candlestick patterns on the chart. Once it detects a formation, the user gets notified about that through the system of built-in alerts.
The Candlestick Pattern Indicator provides the name of all identified patterns on the chart and indicates with the help of arrows what position to open.
The indicator has a settings system.
- If this software draws all found candlestick patterns on the chart, the chart may become unreadable and confuse traders.
Therefore, it makes sense to customize the Candlestick Pattern Indicator in such a way that it identifies not all 30, but 5-6 patterns;
- enable and disable alerts;
- change the color of the text and arrows on the chart
- choose the number of Japanese candlesticks when scanning the chart. The time frame plays an important role here.
If you are going to trade in the 1-hour time frame, the number of elements should be no less than 300. If you decide to trade in the 4-hour time frame, their number should be 500 at least.
Notably, the Candlestick Pattern Indicator is not built on the MetaTrader platform. To use this software, you must download and unpack it on your device first.
Next step, you insert the unpacked files into the Indicators folder on MT4 or MT5.
Once MetaTrader is restarted, the Candlestick Pattern Indicator is ready to work. To add it to the Japanese candlestick chart, you can use the navigator or simply select its name from the list of available indicators in the main menu.
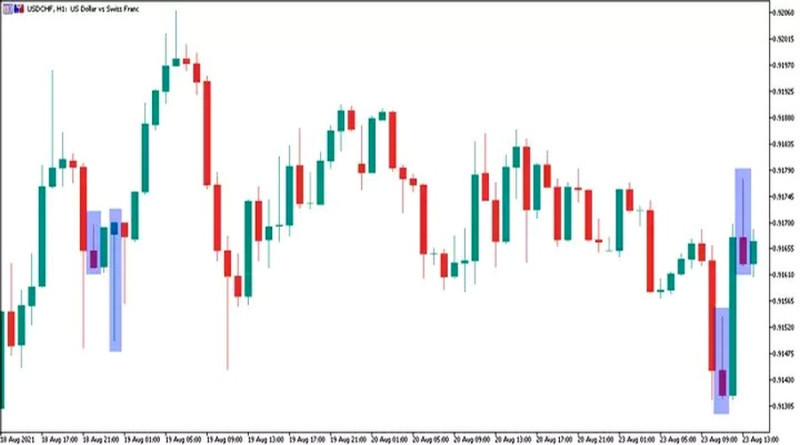
The Pattern Options indicator is another useful tool. It is similar to the Candlestick Pattern Indicator. Their only difference is in visualization.
The Pattern Options indicator also provides the names of all identified patterns on the chart, has built-in alerts, can edit the list of patterns, and shows entry points with arrows.
A green arrow pointed upward says you can buy. Meanwhile, a red arrow pointed downward gives a sell signal.
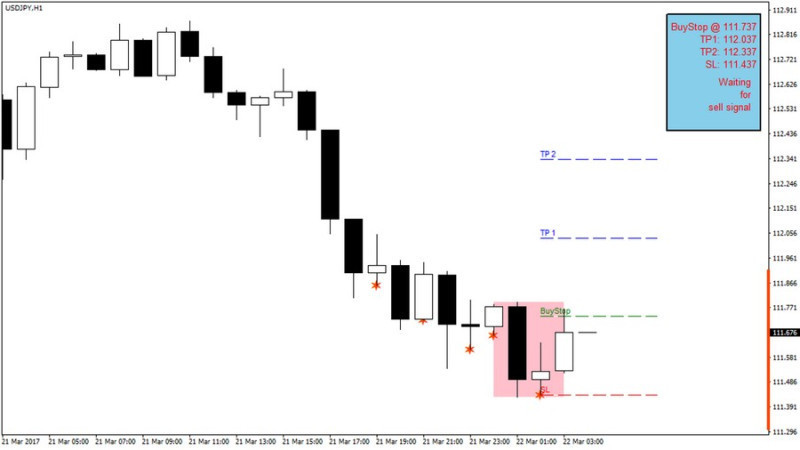
The InsideBarSetup indicator illustrates the so-called “inner bars,” marking each pattern with a star.
Apart from buy/sell signals, this software also says when to place the Stop Loss and Take Profit orders.
Using software for analysis
Thus, software can simplify your work if you use indicators to find Japanese candlesticks on the chart. However, to make your trading efficient, you should also take into account certain features of such software.
1. Time frames are of great importance as they show how reliable patterns are. Time frames are always chosen based on trading strategies. However, patterns can make false signals within shorter periods.
False signals most often occur in the time frames from M1 to M5. Meanwhile, the intervals from M30 to H4 are considered optimal.
However, this does not mean that short-term traders cannot use indicators to analyze JC charts. They simply need to double-check signals.
This can be done by switching to higher time frames and by using additional tools such as the Stochastic Oscillator, the RSI, Support, Resistance, and the MACD.
2. Once the pattern is formed on the Japanese candlestick chart, the user gets a notification from the indicator. However, it is wiser to enter the market at the moment the next element gets closed;
3. The frequency of patterns depends on the volatility of selected assets. Low volatility means you will get rare signals from indicators. High volatility means they will come quite often;
4. The higher the time frame is, the more reliable the signal will be. Support and Resistance are also important in this case. Therefore, they also must be used.
Interpreting patterns
The use of software for analyzing Japanese candlesticks also helps traders read charts. When finding a pattern on the chart, the trader can use the signal from the indicator to open a trade.
The following rules will help traders read charts more efficiently:
- When analyzing charts, context is essential, especially if a pattern consists of a single element. To obtain more information, it is wiser to study the nearby candlesticks and apply additional analysis tools (for example, trend lines);
- To weigh selling/buying pressure, you should pay attention to the length of the candlestick body. The color of the candlestick will help identify the current market sentiment.
- Long candlestick bodies illustrate a strong bullish/bearish bias and the probability of a trend continuation;
- Short candlestick bodies or a horizontal stroke reflect uncertainty in the market and the likelihood of a reversal. This is usually a short-term event, and the price dynamic that follows could be used for opening positions;
- Wiks reflect the volatility and bullish/bearish activity. For example, a long upper shadow indicates that bulls tried hard to push the price higher but failed;
- Japanese candlesticks can give mixed signals. When analyzing, you should notice the moment the pattern appears (it can be the peak or the middle of a trend) and the distance from key levels.
These rules come in handy when you analyze JC charts both on your own and using indicators.
Final thoughts
This article is about how to analyze Japanese candlestick charts using special software or on your own. Both novice and savvy traders can analyze charts with the help of software.
It will save them time, which they can spend on trading.
Only experienced traders can identify patterns without any software. After all, traders have to not only learn and remember the features of patterns and the meaning of their signals but also learn how to scan the market and find formations on the chart.
You can test your trading skills using candlestick patterns on a demo account, offered by many brokers, including InstaForex.
The demo account will give you an insight into what Price Action is and also help you level up.
You may also like
How to read stock charts
How to read investment charts
How to read a stock action
How to read graphs
Best indicators for 1 minute chart


