


Is it possible to learn to trade or is it an inborn gift? There is no straight answer to this question as there are many examples that prove both statements right.
In the 1980s, a debate between two savvy traders on this issue even paved the way for the creation of a unique trading strategy. In this article, we will tell you about the Turtle method and its main features.
If you are interested in other strategies, you can read our article “Forex Strategies.”
How it all began
Forex experts have not been on the same page when it comes to the factors that have a direct influence on traders’ success. Some believe that success depends on inborn talents and gifts.
Others disagree, saying training and practice are behind traders’ success and that inborn abilities have nothing to do with that. The father of the Turtle trading strategy, Richard Dennis, is an avid supporter of this idea. In fact, he is a self-trained trader himself.
He had an argument with his colleague once and even did his own experiment. He studied a group of people who had never been involved in trading before and did not have a deep knowledge of mathematics and statistics.
He searched for participants through advertisements in newspapers and magazines. There were a lot of applicants, but the trader accepted only 14 people, most of whom were men.
His selection criteria are unknown. However, some sources claim that Dennis used IQ testing and a number of other methods to filter participants. He also conducted personal interviews.
Those were people of different professions: a former pilot, an accountant, a businessman, an actor, a card player, and so on.
The participants in his experiment were called “turtles.” This is where the name of the strategy came from.
Why turtles? This is because Dennis and his opponent, William Eckhardt, argued about that on a turtle farm in Singapore.
Dennis was sure that anyone can become a trader under optimal conditions. Eckhard, on the contrary, believed that a person would never become a trader without talent.
Besides, that was a slow experiment.
Both Dennis and Eckhardt were quite well-known people in the trading community. Fame came to Dennis when he earned over $200 million on borrowed $1,600, following his own rules of opening and closing positions.
William Eckhardt was known for reaching an annual return of 29% over 15 years of trading.
The training lasted for two weeks. The trader shared his personal trading experience with his audience.
His trading strategy was based on a scientific method, i.e. on digits and numbers, and excluded any emotional involvement.
Rules of the Turtle trading strategy:
- Traders’ moods and emotions do not interfere with trading.
- Traders act consistently.
- Skills are determined by trading results, not the process.
- If the price moves in line with traders’ expectations, they should know exactly what to do.
- Traders should be prepared for market uncertainty.
- An effective strategy does not have to be complex.
When training was over, the practice began. The turtles traded with small deposits at first.
With time, they gained access to the most advanced trading platforms of that time and to high-liquidity assets. However, they had to follow a certain system with clearly defined entry and exit rules.
True, the participants still had some freedom of action. So, they were given the opportunity to choose a trading approach: short-term or long-term.
The 20-day range was used by short-term turtles, and the 55-day range was used by long-term turtles.
Each turtle trader received $1 million as start-up capital, and the best-performing turtles received $2 million during the trial period. This money was provided by Dennis, which once again confirms how strongly he believed in his own ideas.
Turtles traded various assets, including bond futures, commodities, currencies, precious metals, and stock indices.
At the same time, if a turtle did not want to work with a certain asset, they were forbidden to trade other assets of the same class.
For example, if a turtle refused to trade gold, they were also forbidden to trade silver and copper.
Turtles were also given exact rules regarding trading sizes, entry and exit, Stop Loss, and so on.
What were the results? Not all turtles were able to yield profits after training and practice.
Still, some participants were phenomenal. One of the most successful participants, Curtis Faith, even wrote a bestselling book about Turtles in trading and opened his own investment fund.
Meanwhile, Jerry Parker founded an investment company, and Michael Cavallo received a Harvard University degree.
Conclusion:
- Anyone can become a successful trader.
- If traders stick to the chosen strategy, they will achieve the desired result. Still, there is no 100% guarantee. In five years, the experimental group earned more than $170 million, which is 7.5 times more than the amount of the initial investment. However, the results of each individual Turtle were different.
- The traits of trainees also matter when developing trading skills. Thus, people who are not interested in gaining new skills or are unable to learn for some reason will unlikely become successful traders.
All in all, Dennis won. In fact, he and Eckhardt bet on just $1.
Essence of Turtle Strategy
Richard Dennis developed his trading strategy a few decades ago and did his turtle experiment in 1983. He kept his strategy a secret for a long time although some information about it occasionally surfaced in the trading community.
In 2003, an official website with a detailed description of the strategy was launched. This strategy is considered one of the most popular trending algorithms.
The essence of this strategy is to create the necessary conditions for expanding profit and quickly closing unprofitable trades. In other words, a trader buys an asset during a breakout and quickly sells on a retracement or price fall.
The Turtle strategy is based on the following statements:
- Trading is carried out solely in line with the trend.
- Traders never bend rules.
- Fundamental analysis does not play a key role.
- It is important to keep profits as long as possible and close losing positions as soon as possible;
- When determining a position size, volatility should be taken into account. The size of a position should be larger if volatility is high and smaller if low.
At first glance, this rule seems quite simple. However, not all traders follow it.
Let's see why this happens.
Quite often, beginners close trades that do not bring large profits when there are no exit signals or they keep a losing position open, expecting a reversal that never comes, and incur losses.
The strategy involves holding a position in line with a strong trend. In this case, it does not matter how long it takes, the main thing is to get a profit on the trend movement.
Key principles of Turtle Strategy:
- Trading decisions are based solely on the price of an asset. The trader does not need to analyze fundamental factors and make forecasts using technical analysis because only the current value is used for trading;
- The algorithm is based on 10, 20, and 55-day price ranges that control the general trend;
- The trader should get as much profit as possible from the current trend. If it is a bullish trend, they buy; if it is a bearish trend, they sell and do not wait for peaks and troughs;
- Trading is carried out in a daily time frame. Generally speaking, this strategy is suitable for long-term trading. The trader can open only a few profitable trades during the year, but the final profit will offset losses thanks to the large size of positions;
- The strategy works when there is a breakout through the limits of the price corridor. When there is an intersection, a new trend will highly likely begin in the direction of the breakout;
- A position is opened when the price leaves the limits of a range and it is closed when the price crosses the same corridor but in the opposite direction;
- All emerging signals are used in trading. If at least one signal is ignored, the strategy may get less effective;
- The strategy uses the term “units”, which reflects the size of a position. For example, risk management rules are written based on units, and the trader decides on the amount of money.
Notably, this trading system has its drawbacks and carries certain risks. So, when it is implemented, large drawdowns are observed.
This is due to the fact that some breakouts are false, which leads to losses.
Useful tools
Traders should follow all the rules if they want the Turtle strategy to work, especially when it comes to entry and exit signals.
Such signals come when the price breaks through price corridors in certain periods.
These are Donchian Channels. To build one on the price chart, you should connect the extreme points for a period of 10, 20, or 55 days.
Although drawing a channel on the chart is relatively easy, it still takes some time.
Therefore, to save time, you can use the Donchian Channels and Price Channel indicators.
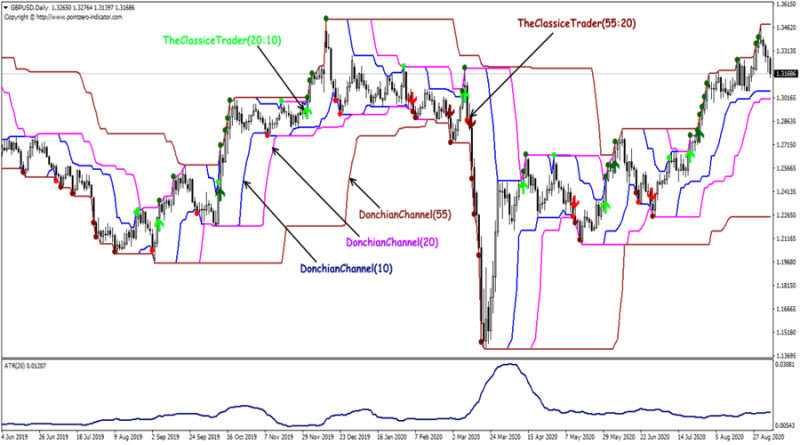
Thus, when using the Donchian Channels indicator, the trader will see two or three lines on the chart. The upper and lower lines connect highs and lows respectively. Meanwhile, the middle line is the Moving Average for a number of days. It is a dotted line which is not always plotted.
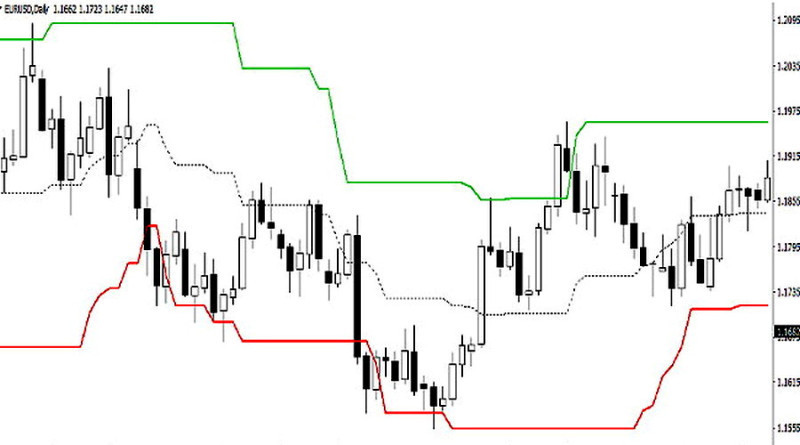
By setting periods 10, 20, and 55 in the indicator settings on the daily chart, the user will get three corridors at once. They are the ones needed to implement the Turtle strategy.
These corridors will contain the extreme points for the last 10, 20, and 55 days. The upper and lower limits of each corridor connect the highs and the lows of an asset.
So, the Donchian Channels indicator is added to the price chart three times. All the patterns are of different colors, which makes them easy to read.
Entry signals are breakouts through the specified corridors. For example, if the price breaks the 20-day channel to the upside, then it goes above the 20-day high.
Conversely, if a breakout occurs through the 20-day channel to the downside, the price goes below the 20-day low.
You can track breakouts yourself or with the help of indicators. It will save you time and energy.
The Classic Turtle Trader. It will mark a breakout point on the chart and notify you about it. The Classic Turtle Trader is an indicator designed especially for that.
It is an arrow indicator, which informs you about breakouts with the help of arrows and points of different colors.
You can determine the current trend by the color of the points. Thus, blue points indicate a bearish trend, while red points illustrate a bullish trend. In fact, color settings can be customized.
Arrows show the entry and exit points. You should never ignore such signals. An upward-pointing arrow signals to buy an asset. A downward-pointing arrow gives a sell signal.
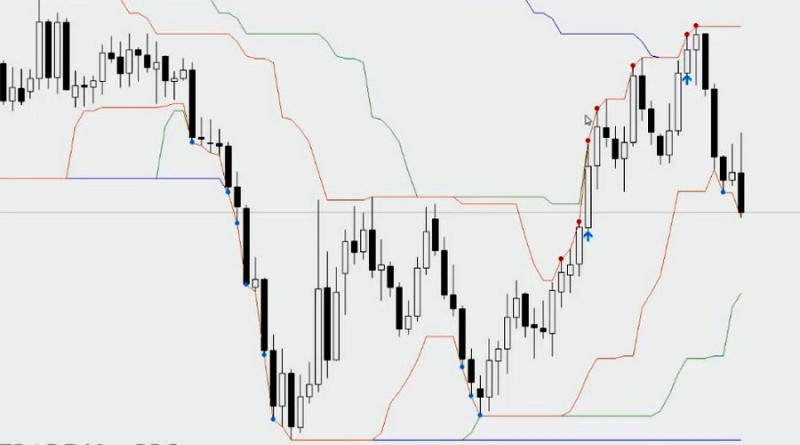
The indicator is added to the chart twice. The first one sets Trade Period 20 and Stop Period 10, and the second one sets Trade Period 55 and Stop Period 20.
All of the above indicators are unavailable for MetaTrader and other popular platforms. Therefore, to use one, you must first download, install, and add it to the platform.
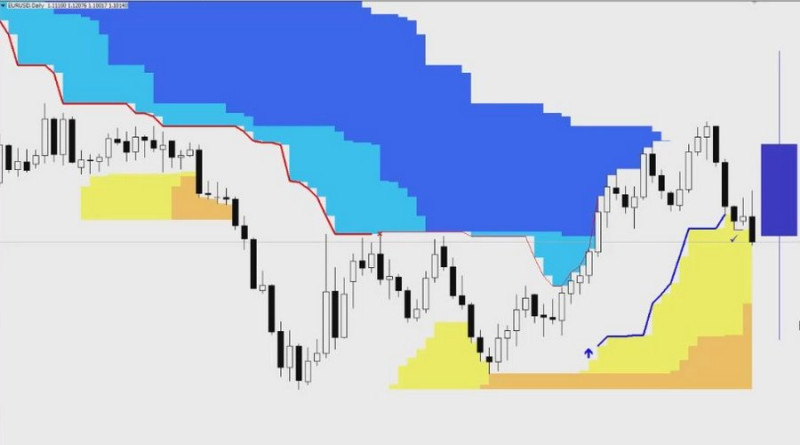
There is also the Turtle indicator, which can also be used with the Turtle strategy. Its function is to color the zones between the extreme points of different price corridors.
Turtle indicator settings:
- Period: time frames from H1 to D1
- Turtle 20: colors range from 10 to 20 days;
- Turtle 55: colors levels from 20 to 55 days;
- Middle Fill: colors the inner range between the highs and the lows for the last 10 days;
- Table Bar: This option calculates and forms a so-called weighted average bar on the chart using historical data, which gets updated daily.
This indicator should also be downloaded. In fact, practicing traders do not use this tool because it overloads the chart visually.
The Average True Range indicator with Period 20 is used for measuring volatility when employing the Turtles strategy. This tool reflects current market activity and is primarily used for placing the Stop Loss order.
The ATR can also predict trend reversals. The higher the indicator figures, the greater the likelihood of a reversal.
The Average True Range is available on many platforms, including MetaTrader. The indicator curve appears in the footer below the chart.
Using these three indicators is enough when employing the Turtle strategy. Here is what the chart will look like:
Conclusions from Turtle trader experiment
Dennis’ experiment revealed that anyone can learn to trade and become a professional. Thus, the first conclusion from the experiment Dennis arrived at is that any trading method can be mastered.
The most important thing here is that a strategy is efficient and has strict and clear rules.
Other conclusions from Dennis’ experiment:
1. No emotions involved. A trading strategy is a set of predefined rules used to make trading decisions depending on the situation, which does not require serious adjustments.
Traders must know exactly when to enter the market, close positions, where to place a Stop Loss order, etc. If at least one piece of a puzzle is missing, they can get emotional and trade relying on instincts.
2. Trading mindset. It is one of the key features traders should have to succeed in their work. Knowing the rules of a strategy and actually using them are two different things.
The trader may get disappointed after a row of unprofitable positions or get too excited about a series of successful trades. Meanwhile, having a trading mindset and psychology helps traders follow the rules of a strategy regardless of various factors.
A savvy trader goes through ups and downs without unnecessary emotions, which allows them to offset all losses and gain profits.
3. Logic of the trading system. Traders must understand the logic of the trading system that they follow. In fact, it concerns any trading tactics.
Otherwise, they will not be able to analyze the efficiency of their trading strategies and fix mistakes if there are any. Sometimes, when a person incurs a loss, they instantly switch to other strategies without giving much thought to their mistakes.
4. Risk management. No matter how efficient your strategy is, you may lose all your money if you do not manage risks wisely.
The turtle traders use a position sizing method known as the “1% risk rule.” The annual profit in this case is about 33%, and the largest drawdown is almost 42%.
Let’s say the trader decided to quadruple the risk. In this case, the annual profit will increase to 76%, and the maximum drawdown to 97%.
With such a drawdown, it is almost impossible to get a profit. So, the deposit will highly likely be drained;
5. When using any strategy, traders should always keep in mind that market conditions change constantly. With time, strategies can get less effective or become unprofitable.
Therefore, any strategy requires timely adjustments. If it is impossible to do, you should find a new option instead of wasting your time and energy on the old strategy.
How Turtle strategy works
Let’s find out how to open and close positions according to the Turtle strategy.
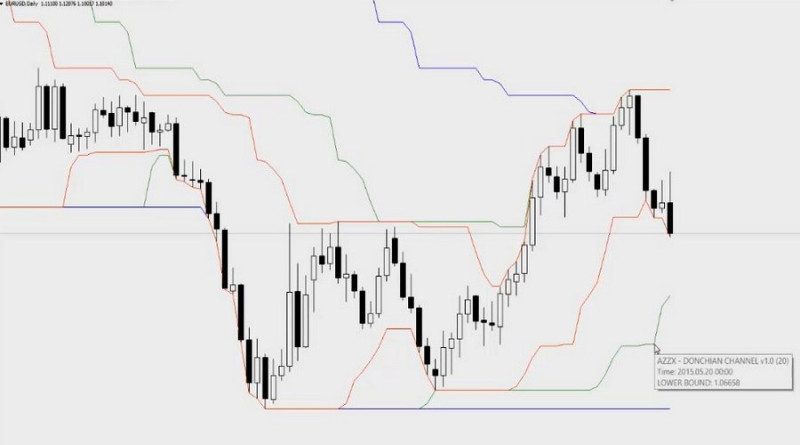
When it comes to positions opening, it could be done both in the short term and the long term. Regardless of what you choose, you enter the market on price crossing over the Donchian channel.
Moreover, to open a position, there is no need to wait for the moment when the corresponding bar, or candlestick, closes. You can open a position when the price starts testing the upper or lower limit of the corridor.
A short-term position is opened when the price crosses the 20-day level, that is, the corresponding Donchian channel. When a breakout occurs to the upside, this is a signal to buy. Conversely, a breakout to the downside is a signal to sell.
It is important that traders check trading results on the previous signal. If it was a profitable trade, the current signal can simply be ignored.
In such a case, a position is opened when the price crosses the 55-day Donchian channel.
It does not matter whether the trader enters the market on the previous signal or not. Potential results are what is most important.
However, if you incur a loss from the previous trade, you must never ignore the current signal. You should always obey this rule.
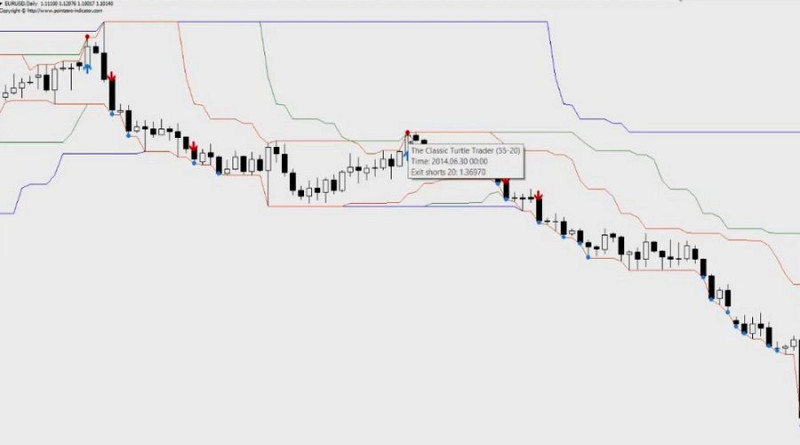
On the chart, EUR/USD is within a 20-day corridor limited by green lines. When a breakout occurs, the trader opens a position.
In the long term, a breakout through the 55-day corridor is used. Unlike in the short-term, it does not matter whether the previous trade was profitable or unprofitable: you open a position anyway.
The recommended trade size, if all the above conditions are met, is one unit.
Let’s now talk about the rules for position closing. You close positions manually.
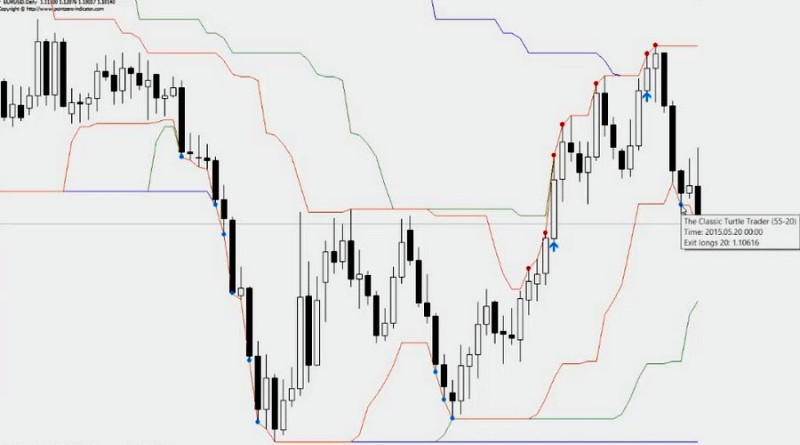
In the short term, you close positions when the price reverses and goes towards the 10-day channel. In the long term, you exit the market when a breakout through the opposite limit of the 20-day range occurs.
According to the chart, the trader closes a long position after a breakout through the 10-day corridor, using the Classic Turtle Trader indicator. Information about when the trader should exit a position is shown in the pop-up window near the point.
Now it is time to learn how to open trades according to the Turtle strategy:
1. The trader draws Donchian Channels on the chart with the help of an indicator with the same name.
2. The trader makes a long-term entry after the price crosses over the limits of the 55-day corridor (blue) and uses the Classic Turtle Trader indicator not to miss a single signal.
3. When a breakout to the downside occurs, the trader opens a short position based on the signal coming from the downward-pointing arrow. Because it is a long-term entry, the trader does not need to check the results from the previous trade.
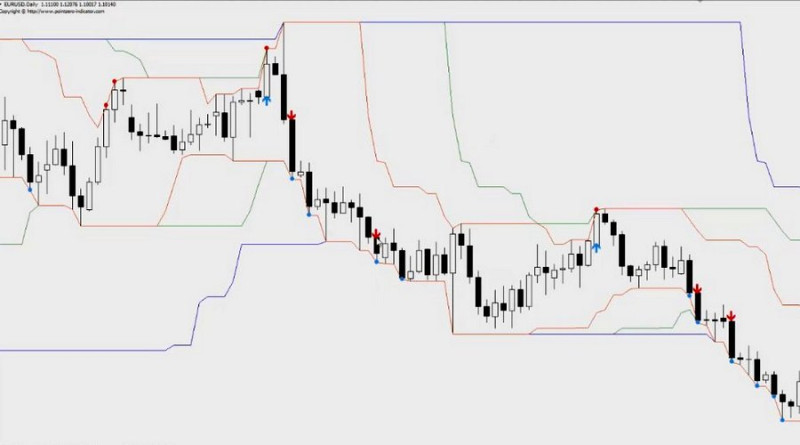
4. A point where the price crosses the 20-day corridor to the upside is used for closing a short trade. The Classic Turtle Trader marks the exit point with a blue upward-pointing arrow.
The Turtle strategy, like many other trading methods, uses a Stop Loss order. However, the basic version of the strategy does not require placing one.
That was due to the fact that prices in the stock market did not change as quickly and often as they do now, i.e. intraday volatility was relatively low.
Nowadays, the situation is completely different. The stock market has changed, and the Turtle strategy is now used for trading in other markets as well.
Thus, in a volatile forex market, placing a Stop Loss order is a must and is set with the help of the ATR indicator.
The Average True Range reading at the time of entering a trade is multiplied by two. The result can be hundreds of pips (most often - 300-400 pips). However, this should not scare traders because the order is placed on the daily chart.
Extreme points can also be used to place a Stop Loss order (3-day lows for long positions and 3-day highs for short positions).
It is important to remember that a Stop Loss order is used for limiting potential losses and triggers very rarely, in case of force majeure in the forex market. Traders usually close positions manually.
The basic version of the strategy also does not require placing a Take Profit either. The reason is the same as in the case with a Stop Loss order: the exit is carried out manually, according to the rules of the strategy.
Additional positions
Richard Dennis' Turtle trading strategy may seem inefficient at first glance. It is difficult to become a gainer when you have just one successful trade and three unprofitable ones.
This particular approach was followed by Dennis' group of turtle trades. However, they also aggressively managed the size of positions.
One such approach is pyramiding.
This term refers to a trading strategy that increases positions whenever the price changes in the trader’s favor. There can be no more than three additional trades. So, it is allowed to open four positions in total.
Each additional position has the same number of units as the first one. This is the main difference between the pyramiding method and the Martingale strategy where each new position is doubled in size.
Using the pyramiding strategy, the second order (the first additional position) is opened after a profit from the first position reaches 0.5%
All subsequent positions are opened based on the same rule. What is important is having a strong trend. Otherwise, using this method will be very risky.
Orders are gradually closed (starting from the last position) when the first signs of an upcoming reversal come.
Here you can see how additional sell orders are opened, according to the pyramiding strategy.
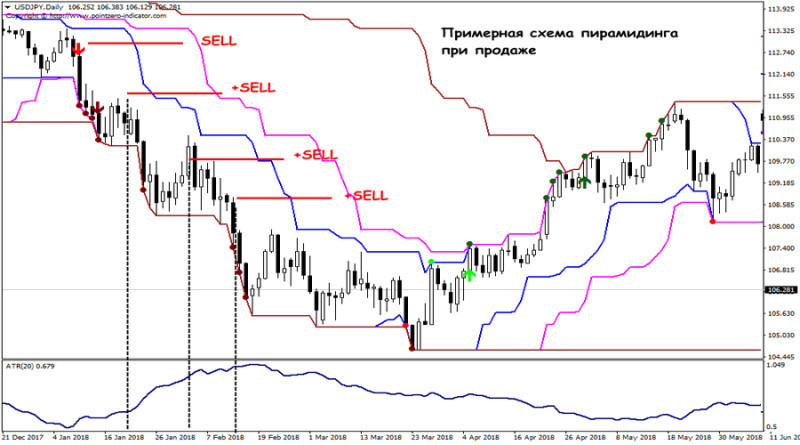
Still, it is important to remember that volatility is high when you open additional positions. For this purpose, the ATR is used.
If volatility is low but the trend is strong, you should analyze fundamental factors even though it is not required under the Turtle strategy.
Let’s say a trader decides to open a $100 trade on Forex.
The trader opens a long position after the price crosses the upper limit of the Donchian Channel (Period 20).
After a breakout, the price continues to rise in line with the trader’s expectations. When a profit of at least $5 (0.5% from the deposit) is yielded, the first additional position is opened.
Its size is also $100. When a profit increases to $15, it is time to open one more additional position.
A Stop Loss is placed at the lowest price in the past three days. To do this, you count three bars (candlesticks) from the entry price and find the lowest price.
A point equal to 1% of a deposit also can be used for setting a Stop Loss.
Let's say the amount on the trader's deposit is $1,000, the required value in this case is $10. After that, the trader needs to look at the cost of a point and divide $10 by this number.
The Stop Loss distance must be measured from the entry point in the opposite direction from the trend.
Because a Stop Loss in this method is used exclusively for safety, you must close positions manually. In our example, the trader closes a position when the price breaks the low of the 10-day channel.
Meanwhile, a signal to close a short position would come after a breakout through the high of the 10-day channel.
Present-day Turtle strategy:
In our article, we have repeatedly mentioned that the original strategy is somewhat different from the one traders use today. With time, the Turtle method has undergone some changes.
Currently, due to higher volatility, a 200-day channel is used for entering. This rule is widely followed by crypto traders.
Nevertheless, the focus is still on risk management and trading psychology. After all, the goal of Dennis’ experiment was to prove that anyone can trade whether they have inborn talents or not.
The rules of the modern Turtle strategy:
1. The trade size should not exceed 1% of the deposit. On each additional position, you can spend no more than 0.5% of the deposit.
The Turtle strategy may seem a waste of time for traders with limited funds due to small profits gained from equally small deposits. However, this is a long-term method that involves several assets, which means the final profit can be good enough.
2. If there are signs of consolidation on the chart, you should close positions and trade another asset. Notably, Turtle traders work only when there is a trend movement, and a profit should offset losses.
3. You should always keep an eye on volatility because this will help you when using the pyramiding method. It is also important that you trade only high-liquidity assets.
4. You can change the rule of entry if necessary: instead of a breakout through the 20-dap range, you can use a breakout through the 90-day range or the 200-day range. In this case, you should also adjust the rules of closing positions. Thus, if you use the 90-day range for entering, the 45-day range should be used for closing positions.
This is due to the fact that price fluctuations of all assets have increased since the 1980s when the strategy was developed. To eliminate market noise, a breakout through a higher period of the channel should be used;
5. A Stop Loss is placed based on the ATR. However, its current value should be multiplied by three or four instead of two.
This is especially relevant to highly volatile assets such as GBP and JPY;
6. You should also turn to additional tools, ex. the Moving Average;
7. You should diversify your investment portfolio and allocate risks to different assets in different markets. The more assets you use in trading, the higher the likelihood of catching a strong trend.
8. Risks must be allocated equally. So, risks should be distributed between inversely correlated assets on Forex, i.e. currency pairs.
In such a case, losses on one asset will be offset by profits on another. At the same time, it is important that the total load on the deposit does not exceed 40%.
9. The Turtle strategy is meant for medium-term and long-term traders. If you are a short-term trader, you should open a separate account for that.
10. Intermediate profits should be locked in. For example, you can partially take profit when the target level of 10 ATR from the entry point is reached.
Experts argue about the efficacy of the Turtle trading strategy to this day. Trading Blox studied the method between 1970 and 1986 when it was known only to Dennis.
Back then, its profitability totaled 216%. However, already in 17 years, it dropped to 10.5%
According to Trading Tuition, profitability increased to 30% between 2004 and 2016.
The latest data revealed a 32% return and a 42% drawdown from the Turtle strategy.
Final thoughts
All in all, a bet between two traders became a large-scale experiment, which proved that anyone can become a successful trader whether they have an inborn talent for that or not.
All you need is an efficient trading strategy and clear rules.
Although it came decades ago, the Turtle strategy is still widely used. With Dennis’ method, long-term and medium-term traders can yield a profit by following the basic rules of the strategy.
Here are a few more features of this method:
- It can be used on different platforms by preinstalling necessary indicators.
- This method has proven efficient when trading currency pairs, stock indices, commodities, etc. It has recently been increasingly applied to trade cryptocurrencies although risks are too high in this case.
- A few successful trades amid a row of unprofitable ones is a norm. The key is to keep successful positions open as long as possible and to close unprofitable ones as quickly as possible.
- It is a simple and clear trading strategy for beginners to understand. However, it does not mean that it suits all traders without exception.
- This method does not guarantee profits. In fact, neither strategy does.
You may also like:
Support and resistance trading strategy


