


Trading is all about making profit. This requires a certain plan of action that should be based on an effective strategy.
The best way to ensure profit is to stick with time-tested trading methods, and the MACD strategy is one of them.
In this article, you will learn how and when the MACD indicator is used and what are the benefits for traders.
To deepen your knowledge of other trading methods, read the article Forex Strategies.
About MACD strategy
As the name of the strategy suggests, it is based on the MACD indicator. The MACD indicator shows convergence and divergence of the moving averages which provides valuable information for traders.
The indicator evaluates the strength of an upward or downward dynamic in the price of an asset. The MACD can be used as a momentum indicator or an oscillator.
This makes it one of the most popular tools in technical analysis.
The indicator is displayed just below the asset’s price chart and is not plotted directly on it. It consists of two lines and a histogram featuring bars of various lengths.
The major line, or the MACD line, is calculated using a special formula. It is essential for understanding the main idea behind the MACD, so let’s discuss it in more detail.
We will need two exponential moving averages (EMA) of the 12-day and 26-day periods. In other words, these are “fast” (12) and “slow” (26) lines.
The MACD line is calculated by subtracting the 26-period EMA from the 12-period EMA. Also, the formula requires the value of the closing price.
The MACD line is very informative even when used on its own. If the line goes below the baseline pointing downwards, this is a sign of a strong bearish trend with big downward potential. If this line is located above the baseline and is headed upwards, the trend is clearly bullish.
Another line is a signal line which is a 9-period EMA. It serves as a trigger for making trading decisions.
Its crossovers with the MACD line can signal a reversal in the trend. We will discuss this topic below.
The first line is usually blue by default while the second line is red. Colors can be changed in the settings.
The smoothed lines filter out false signals that may appear when large market players enter the game.
A histogram shows the relationship between the MACD and the signal line. When they diverge, the bars are getting longer and when they converge, they become shorter.
Besides, the bars of the histogram can be located differently relative to the baseline. They are in the green zone when the MACD line is above the signal line.
Conversely, the histogram enters the red zone when the MACD line is below the signal line. When these lines cross, the histogram also crosses the baseline.
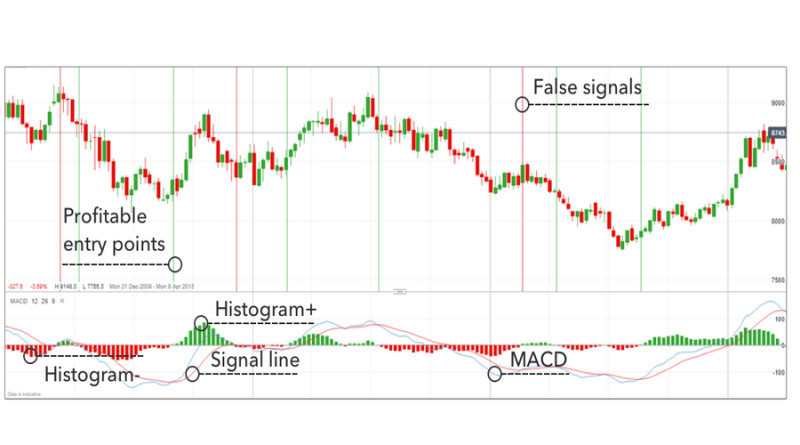
In the screenshot below, you can see the MACD indicator and its main components with explanations. In this case, the signal line is blue and the main line is red which means that default colors have been changed in the settings.
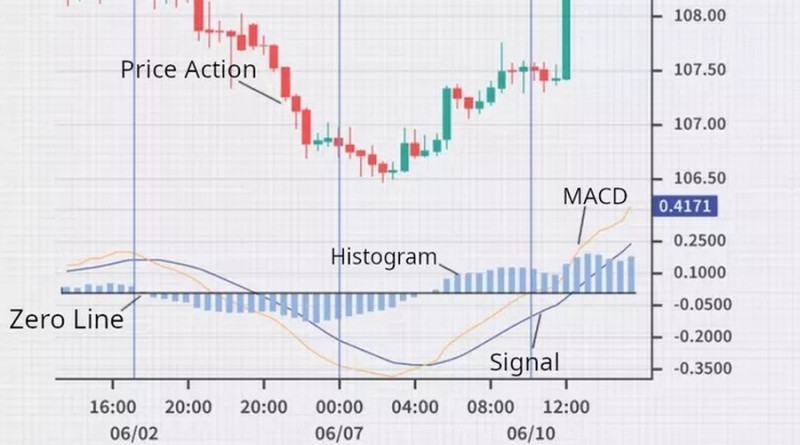
This is what we can read when looking at the chart above:
- The direction of the price and its momentum;
- Divergences, if any;
- The highest and the lowest bars of the histogram;
- Points where lines cross.
Based on this data, different MACD strategies are built.
The MACD indicator was invented by Gerald Appel, a specialist in technical analysis. His idea to use moving averages in trading appeared in the 1970s. At first, the indicator consisted of lines only.
Later, this method was improved by Thomas Aspray who added a histogram to the indicator. This made the representation more visual and, therefore, more informative.
What is MACD divergence?
The movement of the price does not always coincide with what a histogram shows. If the price is moving in an opposite direction from the MACD, this is considered a divergence.
Let’s say, the price is steadily moving upwards, hitting new highs, while histogram bars are gradually getting lower. This is what a divergence is.
In this case, we can assume that the uptrend is losing momentum and may soon reverse. It is very likely that the price will eventually move in accordance with the indicator.
However, a reversal may never happen as a divergence simply suggests such a possibility. Most of the time, divergences occur when an asset is overbought or oversold, and traders start to lose interest in the asset.
In the screenshot below, you can see an example of a bullish divergence.
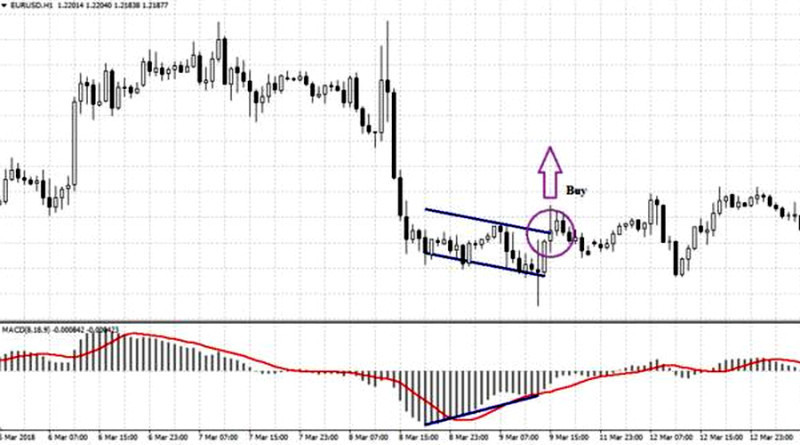
How to trade using the MACD divergence? Let’s consider the example of a bullish divergence presented above.
It is recommended to enter the market at the moment when the MACD histogram has formed two rising lows that are becoming shorter with every time. In this case, the buying scenario is relevant.
The breakout of the resistance line can be used as confirmation.
Stop Loss should be placed below the recent low.
In case of a bearish divergence, a sell position should be opened when the histogram forms two lower highs. Stop Loss should be set above the recent high.
Sometimes the price continues to move in the previous direction regardless of the divergence. This can lead to a triple divergence.
Therefore, it is necessary to monitor price movements even if you think the divergence was false. There is a chance that this divergence will get bigger, creating new opportunities for entry.
Apart from a histogram divergence, there is another type of it based on the main MACD line. Regardless of the divergence type, it is recommended to use only those divergences that occur at the end of the trend movement.
Crossovers
The crossover of the two indicator lines is also used as a trading signal.
If the MACD line crosses above the signal line, this is considered a sell signal. Conversely, when the main line crosses below the signal line, it is the right time to open a buy position.
At the moment of the crossover, histogram bars will change relative to the baseline. This makes it easier to spot a breakout even for a beginner.
For confirmation, higher time frames can be used. For closing a trade, an opposite signal should appear.
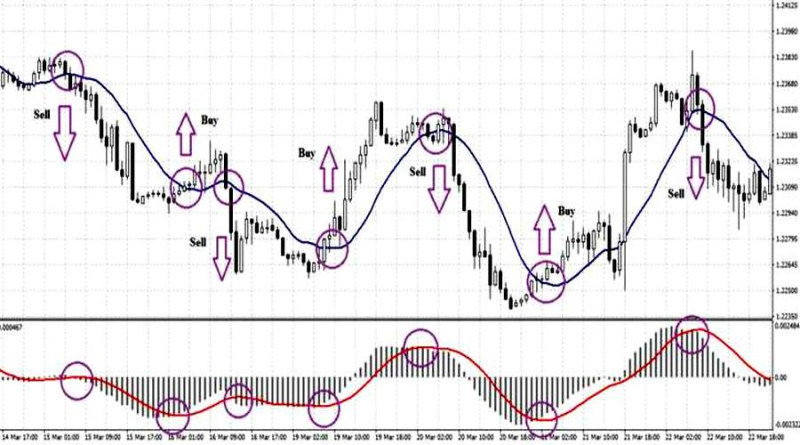
The screenshot below features examples of entry points. The MACD line is red while the signal line is colored blue.
The crossover strategy is lagging by nature as it is based on waiting for a movement in the price before opening a position. If the market trend is weak, the price may be reaching a reversal point by the time a signal is generated.
This is the main issue with the MACD crossover.
The graph below highlights a standard crossover method. Profitable entry points are shown as green horizontal lines.
Losing positions that were opened following a false signal are presented with red vertical lines.
It is worth noting that trading signals are also generated when histogram bars reach certain highs and lows, indicating corrective pullbacks or potential reversals.
To confirm or disregard such signals, additional indicators and price action methods are required.
Zero crossover and histogram reversal
The baseline, also called the zero line, is an important element of the MACD strategy as its crossovers provide valuable information for traders.
When working with a baseline, two approaches are possible.
In the first approach, traders need to watch the bars of the histogram as they reflect the momentum of the current trend.
When histogram bars increase in height, this indicates a strong dynamic. When bars become shorter, the trend is nearing its exhaustion.
A reversal in the histogram signals a change in the trend, and this signal is not delayed.
When a histogram crosses the zero line and moves downwards, this serves as a clear signal to sell an asset. Conversely, when a histogram moves above the zero line, it is a good time to buy.
It is better to wait for at least two counter-trend moves in the histogram. This will mitigate the chance of a short-term move.
You should exit positions when the MACD starts to reverse in the opposite direction.
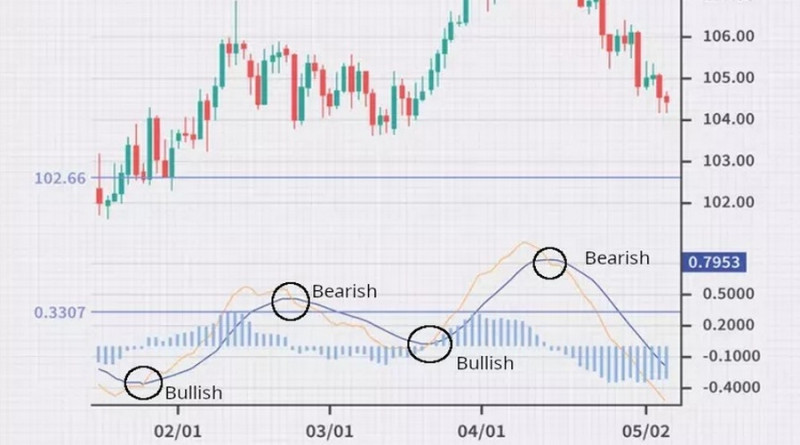
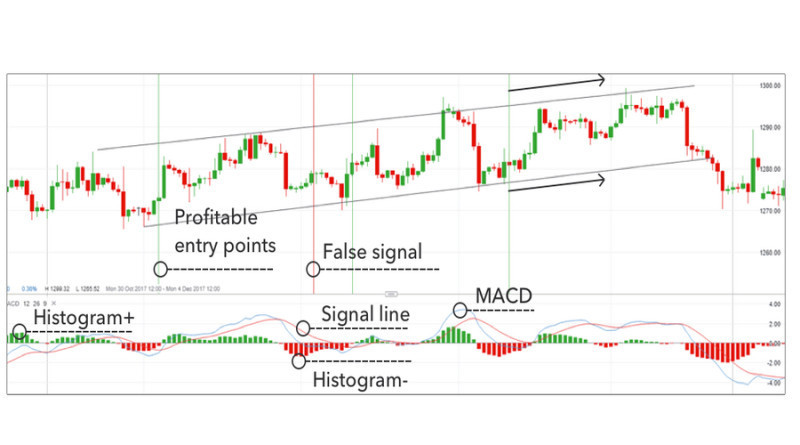
The picture below displays a real trading situation with several profitable and one losing trade that could have been the result of a false signal.
The second approach is based on moving averages crossing the zero line. If the lines cross the zero line from above, this is a bearish signal and short positions should be opened. If the crossover comes from below, this is a bullish signal presenting a buying opportunity.
The strength of the signal is measured by the length of the histogram bars. The higher the bars, the stronger the signal. If bars are too short, it is not recommended to enter the market.
The key point here is to accurately define an entry point and a stop-loss level.
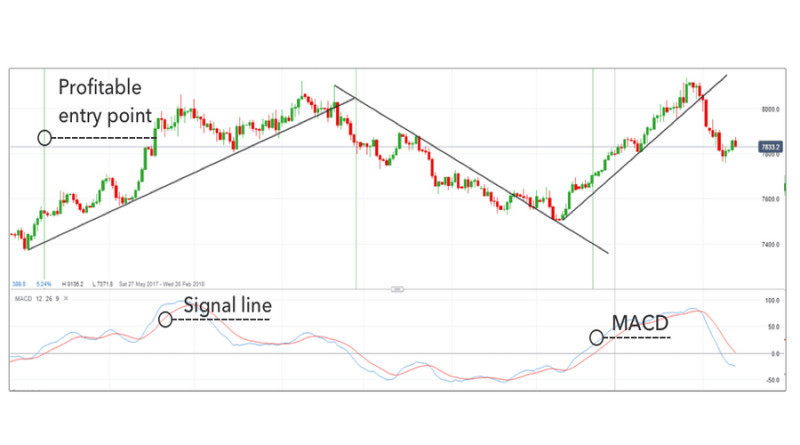
The chart below shows several breakouts of trendlines. These crossings could signal a good time to exit a trade.
Alternatively, a trader could close a trade after a break below the previous swing low (bullish trend) or above the prior swing high (bearish trend).
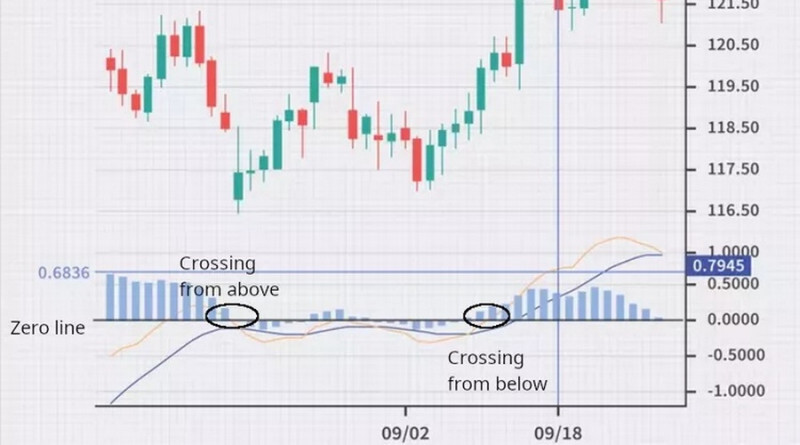
Now let’s take a closer look at how the MACD zero cross strategy looks in practice.
As shown on the chart below, the red MACD line has crossed below the zero line and moved downwards. Then it broke above the baseline from below.
These moves are accompanied by histogram changes: bars are getting shorter, thus confirming a selling opportunity after the second breakout.
When the price moves upwards, a trader could close a short position with a profit.
Later on, it is possible to open a long position when the MACD line crosses the zero line from below. Potential entry points are circled on the chart.
Key points of MACD strategy
Beginners may want to know when is the best time to use the MACD indicator. Actually, there is no answer to this question.
The thing is, every strategy must meet the needs of a trader and his/her trading plan.
Some traders do not use technical analysis at all. Besides, each of the above-mentioned strategies has its pros and cons and requires certain skills from a trader.
For example, if you choose a lagging strategy (crossover), you will have to carefully monitor the MACD indicator to get entry signals as quickly as possible.
With a leading strategy, such as the one that involves a histogram, you will need to spend less time watching MACD as signals will be generated in advance.
MACD strategy key takeaways:
- MACD is one of the most popular indicators for technical analysis;
- The indicator consists of three components: two moving averages and a histogram;
- There are three common MACD strategies: crossovers, zero crosses, and divergences;
- There is no best time to use MACD. You should rely on your personal preferences and trading plan;
- The strategy should be used in a trending market.
We would like to discuss two common mistakes that traders often make when dealing with the MACD indicator.
The first difficulty comes when traders try to implement the crossover strategy in the absence of a strong trend. This situation generates many false signals that may lead to financial losses.
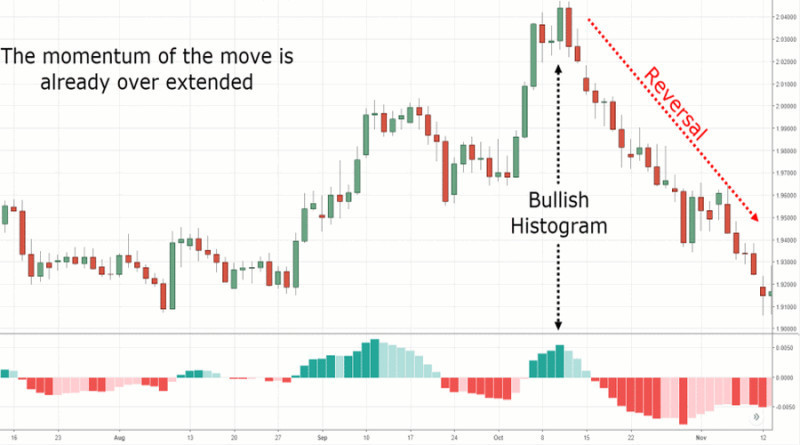
The second mistake comes from the wrong interpretation of a histogram. For example, a novice trader may see the setup on the chart below as a good moment to buy an asset as the current momentum appears to be really strong.
But in fact, it is already too late to open a position. The only way out here will be to trade against the trend and open positions on a reversal.
Pros and cons
There is no such thing as a perfect trading strategy. Every strategy has its strong and weak points, and you need to decide whether you are ok with them or not.
The same is true about the MACD strategy. It also comes with risks and can not guarantee you a 100% profit.
Advantages of MACD:
- Easy to read for both new and experienced traders. Besides, this is a default indicator in the MetaTrader platform;
- It can be applied to any asset and any time frame. H1 and higher time frames are considered to be the best time intervals for this strategy. If you trade Forex, it is better to choose majors and cross rates and avoid exotic currency pairs;
- It generates clear and ample trading signals;
- The indicator features various settings options that allow you to change colors, time frames, and other parameters;
- MACD can be used as a standalone indicator and does not require additional tools.
All these benefits make MACD extremely popular among traders.
If you want to work with a simple yet effective tool that does not interfere with the chart and provides regular signals, then the Moving Average Convergence/Divergence is your choice.
Disadvantages of MACD:
- It may generate false signals, especially in a range-bound market or on lower time frames. Sometimes the indicator changes direction within seconds which may result in losing trades;
- The indicator is less effective during a sideways movement. In this case, the MACD is hovering near the zero line;
- Some MACD signals are lagging which leads to late market entries and lost profit opportunities. Therefore, this indicator should not be used for scalping.
Additional indicators to complement MACD
Although the MACD indicator is sufficient as a standalone tool, it is best used with other indicators and forms of technical analysis. Some traders combine it with support and resistance levels on lower time frames.
This allows them to identify entry and exit points more accurately and benefit from more trading opportunities.
Let’s discuss what other indicators can be used along with MACD.
1. The Moving Average (MA) helps define the direction of the price and smooths out price noise and market volatility. The strategy is based on the MA crossing the price level.
Let’s say, the MA crosses below the price level and so does the MACD line when crossing the histogram. This is a signal to open a short position as quickly as possible.
Conversely, when a crossover happens in the opposite direction, consider opening long positions.
This strategy filters out many false signals. Some losing trades that may occur are offset by large profits amid a strong trend. The chart below shows an example of the MACD and MA used together.
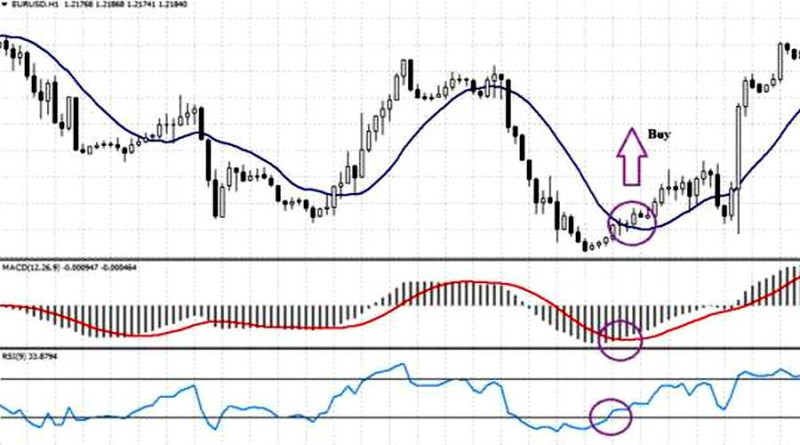
2. Moving Average and RSI. This strategy involves the use of three indicators, with each of them having a special function.
The Moving Average identifies the trend and the direction of trading, while the Relative Strength Index (RSI) shows best entry points for opening a trade. Such an approach enables traders to make the right entry decision and maximize their profits.
Long positions are relevant when all the below-listed conditions are met:
- The price level crosses above the Moving Average;
- The MACD line is moving in the same direction relative to the histogram;
- The Relative Strength Index is holding in the oversold area but then breaks above 30 and moves upwards.
As can be seen from a screenshot below, entry points are circled and displayed both on the price chart and indicators’ charts.
As for short positions, they should be opened when conditions are opposite to the ones described above.
In this case, the RSI helps eliminate lagging signals, while the Moving Average and MACD filter out possible false signals.
The MACD strategy can also be confirmed with the help of such patterns as Head and Shoulders, Triple Bottom, and so on.
You should look for these patterns on the histogram chart. However, they are not very common in this case and, therefore, won't provide enough signals.
Besides, experienced traders find this combination more complicated and think that it may not be worth the time and effort.
Conclusion
The MACD strategy can be a helpful tool in generating profits if its signals are interpreted correctly. In addition, you should not forget about some basic principles of risk management. The strategy is quite simple which makes it suitable for traders with different experience.
We recommend testing the strategy on a demo account first. You can open such an account with InstaForex in just a few clicks.
You may also like:
Support and resistance trading strategy


