


When choosing a trading strategy, each trader is guided by the most important criteria. Someone is guided by simplicity, while someone prefers efficiency.
The Good Martin strategy has both criteria. What is its essence, which signals are used for trading, and what rules should be followed, you will learn from our article.
If you are interested in other trading strategies, we recommend the article "Forex strategies." It provides detailed information about the most effective strategies for traders with different levels of trading skills.
What strategy includes
The Good Martin strategy was created for traders who want to trade with minimal risks. With all its effectiveness, the strategy is quite simple and versatile.
It can be used by both professionals and traders who are just starting their way in the world of trading and do not have deep knowledge and extensive experience.
The Kind Martin is based on two technical analysis indicators. These are MACD and Parabolic SAR.
In addition, elements of the Martingale strategy are used.
Let us tell you about these indicators in more detail.
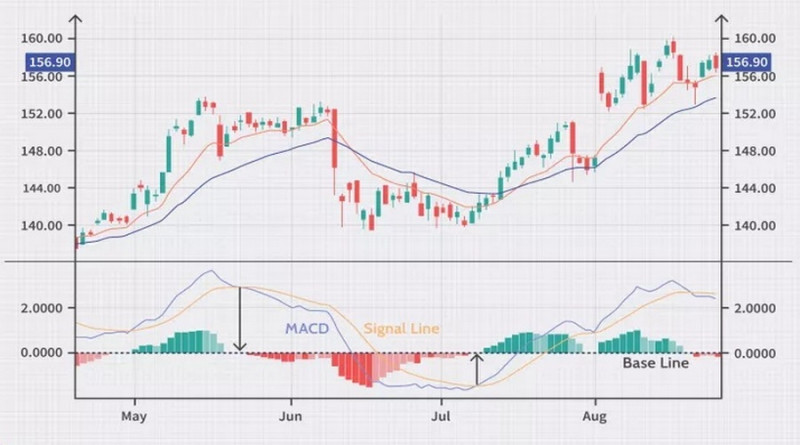
MACD is an algorithm that works as a trend indicator and oscillator. In the first case, it determines the direction of the price movement, in the second, it indicates overbought and oversold zones, which can be used to predict a trend reversal.
This indicator is used very often. Firstly, it is already built into MetaTrader, so you do not have to download, unzip, and add it to the platform.
Secondly, it generates a large number of signals, thereby opening a trader a lot of opportunities to enter and exit the market. The most common techniques involve the use of divergences, crossing elements with each other and with the zero axis.
What does MACD look like? Notably, all elements of the algorithm are located below the chart.
The first part of the MACD is two EMAs with different periods. One of them is called the main line, and the second one is called the signal line.
The indicator’s chart demonstrates the interaction between the lines. The bars tell when the trading asset is overbought or oversold.
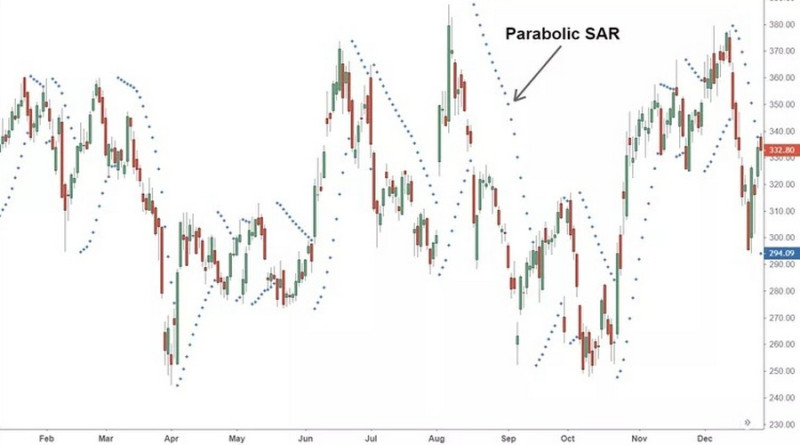
Parabolic SAR is used in trading to identify upcoming reversals of the current dynamics. Its main value lies in the fact that it gives clues about the most optimal points to open and close a trade.
The indicator is located directly on the chart and represents a set of points (often blue).
On some platforms, they are connected, resulting in a curve. The method of display does not affect anything, it all depends on the personal preferences of the trader.
The screenshot shows that the Parabolic SAR is either above or below the price of an asset. It depends on the price movement.
If the price is rising, the points are located below the candlesticks or bars. When there is a bearish trend on the chart, they are positioned above the candlesticks or bars.
Accordingly, when there is a crossing, it is possible to talk about a break in the trend. If the PSAR breaks the price chart from below, it is better to sell the asset and buy it if otherwise is true.
It is important to understand that crossing the price with Parabolic SAR points is not a hundred percent guarantee of a reversal. Let us explain why.
The fact is that the algorithm continues to draw points even when the price of the asset does not change. Imagine that the price of a currency pair increases and then moves sideways.
What does the indicator do? It gives a reversal signal even though the chart shows a flat.
The popularity of Parabolic SAR is because its signals are sufficient for implementing any strategy. To minimize the risk of using false signals in trading, it is better to use other indicators.
This algorithm is also built into popular platforms including MetaTrader.
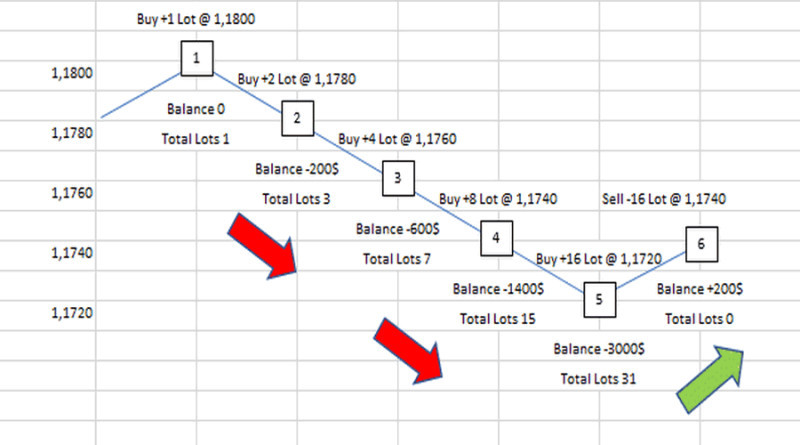
Another component of the Good Martin strategy is the Martingale strategy, which has migrated to the financial markets trading from gambling.
Its essence is that after a losing trade, another one is made in the same direction, but its volume should be twice as large as the previous one. This continues until the profitable position will cover the losses of all unsuccessful ones.
After that, trading can be continued, once again starting with a small trade size.
This strategy is very ambiguous and causes fair criticism. Here are the main reasons for the distrust of this trading method:
- The theory of probability, which assumes a 50/50 chance of success in trading, does not always work;
- There is no guarantee that a series of losing trades will be followed by a successful one;
- With each losing trade, the losses on the deposit grow, and there is a risk of complete loss of funds in the account.
The Good Martin strategy assumes that a trader is hedged with two indicators. This means that the probability of an unfavorable outcome of trading is minimal.
How to trade with Kind Martin
We have already talked about the elements of Kind Martin. Now, let's describe how all three elements work together.
Let's start with the choice of a time frame. It is believed that the minimum period that is acceptable to use in Kind Martin is M15. At the same time, the best is the higher time frames (M30 and higher).
The settings may look as follows:
- MACD: 12 - 26 - 9;
- PSAR: 0.02 - 0.02 - 0.2.
To decide whether to buy the selected asset or not, a trader should make sure that the following conditions are met:
- The point of Parabolic SAR is fixed below the price, while the previous one was located above it, i.e. a breakthrough occurred. In this case, it is possible to say that an uptrend has begun;
- The MACD lines intersect below the zero axis. Another option is the crossing of the zero level from above by the histogram of this indicator, which should occur during the formation of the first three lower points of the PSAR.
You may open a short position when the situation is otherwise:
- PSAR points after breakout begin to form above the candlesticks. This means that a bearish trend is emerging;
- During the appearance of the first three upper points, the bars of the histogram cross the zero axis from above. It is at these points that the main and signal MACD lines cross.
At the same time, traders should use stop-loss and take-profit orders to implement the Good Martin strategy properly.
You can use two approaches to find the optimal levels for setting them. In the first case, you can place a stop-loss order near the highs or lows. As for take-profit orders, it is better to place them 1.5-2 distances from the entry point to the stop-loss order.
Another option is to use the points directly, that is, the PSAR signals.
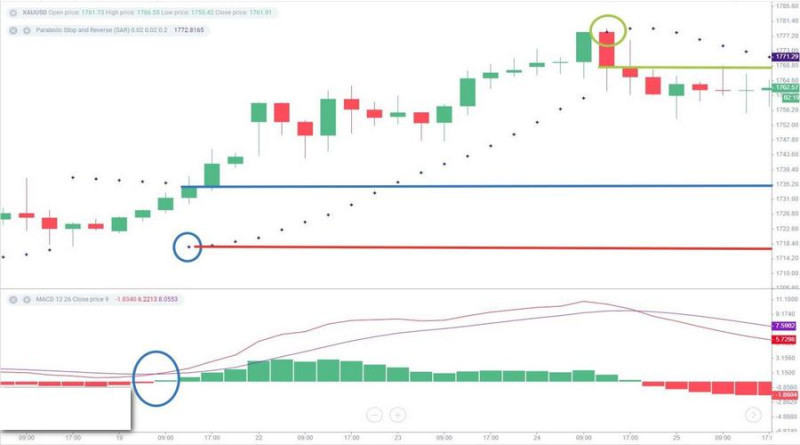
A specific example of opening a long position is shown in the screenshot. The points where the bars of the histogram cross the zero axis, as well as the first point, formed below the price, are marked with blue circles.
The lower crossing (we are talking about the indicator chart) occurs a little earlier than the upper one, but it does not contradict the Kind Martin rules. The horizontal blue line is the entry point.
The stop-loss order is marked with a red line, that is, the first lower point of the PSAR is used as the basis for its setting. The distance of two stop-loss orders from the entry point makes the distance for setting a take-profit order.
In the screenshot, we can see that a gap is formed in a green circle, i.e. a parabolic reversal. This indicates the need to exit, the point of closing the trade is marked with a green line.
The situation in financial markets is quite often unpredictable, so there is always a risk of making losing trades. To make the Good Martin strategy more effective, elements of the Martingale strategy were added to it.
Here is an example from gambling. Here, everything is much easier than in forex trading since gamblers just need to make a bet on the outcome of an event.
Without resorting to analysis and relying solely on luck, gamblers end up either a winner or a loser.
Imagine that a player has made a bet of $1 and lost. In this case, following the Martingale strategy, he needs to continue the game but make each following bet twice as large as the previous one.
That is, the new bet will be $2, if it does not bring profit, the next one will be $4. According to probability theory, sooner or later the player will win, which will allow them to cover the losses.
In forex trading, everything is a bit different. Firstly, a trader may simply have not enough money on the deposit to finish trading according to Martingale, i.e. to wait for a profitable trade.
Secondly, the drawdown is of great importance. In turn, depends on the point value.
For example, if the amount on the account allows a trader to handle a drawdown of 300 points, then the allowed drawdown will automatically decrease as a result of increasing the trade volume. In this case, the pip value will become higher and, as a result of several losing trades, the trader can lose all money.
Thus, such terms as winning and losing bets are not used on Forex. The position volume is calculated not in the nominal amount, like at the casino, but in lots.
The most important thing a trader should do is to find the golden mean between increasing position volume and stop-loss/take-profit orders.
Pros and cons
Some traders regularly use the Good Martin strategy, while others use it very rarely or avoid it altogether. What is the reason?
The reason is that this strategy has its advantages and disadvantages, which are characteristic of all strategies without exception. If users see that the advantages have more weight and offset all of the disadvantages, they use the Good Martin strategy.
If the opposite is true, this method is not used in trading. It turns out that everything depends on the personal preferences of a particular user.
Pros of Kind Martin:
- Reliability. The strategy consists of three elements, so you can filter out false signals and trade with minimal risks;
- Indicators needed to bring the strategy to life are built into popular terminals by default. For example, in MetaTrader, you only need to configure the parameters of each of them and add them to the chart;
- The Martingale strategy bears high risks but its simultaneous use with technical indicators may cover losses;
- The strategy is self-sufficient and does not require additional tools.
Cons of Kind Martin:
- When implementing the strategy, one should not count on big profits;
- With each new unsuccessful transaction, the risks increase as the trader has to double the trade volume. As a result, the trader is forced to violate the principles of risk management if there is not enough money in the account;
- The method loses its effectiveness when the market moves sideways;
- It is not recommended for beginners as the elements of Martingale's strategy are used;
- The strategy requires large initial capital in case there will be a series of losing trades. For the same reason, rapid loss of the initial deposit is possible.
Recommendations for use
If you want the Good Martin strategy to meet your expectations and bring profits, it is necessary to follow certain rules. They are formed taking into account the peculiarities of MACD and PSAR, as well as the Martingale strategy.
Here are the most important ones:
- Test the strategy on a demo account. A training account will allow you to better understand the strategy, to evaluate its effectiveness with zero risks;
- At the beginning of live trading with Kind Martin, use cent accounts. For example, such an account can be opened with InstaForex;
- Do not use lower time frames. As we mentioned earlier, price movements on time frames up to M15 can be particularly unpredictable, which increases risks;
- Always place stop-loss orders. A take-profit order is optional and it can be moved manually;
- Start trading with the lowest possible trading volume as it is possible that later you will have to increase it;
- Do not open a position during flats. Kind Martin assumes entering the market at the beginning of a strong upward or downward trend. If there are even minor signs of correction, it is better to refrain from trading;
- If a reliable signal is generated, it is necessary to enter the market as soon as possible. Otherwise, you can miss the potential profit;
- Check all of the signals generated by the indicators. In trading, there are a few of them and if the signals are skipped, the financial result will be questionable;
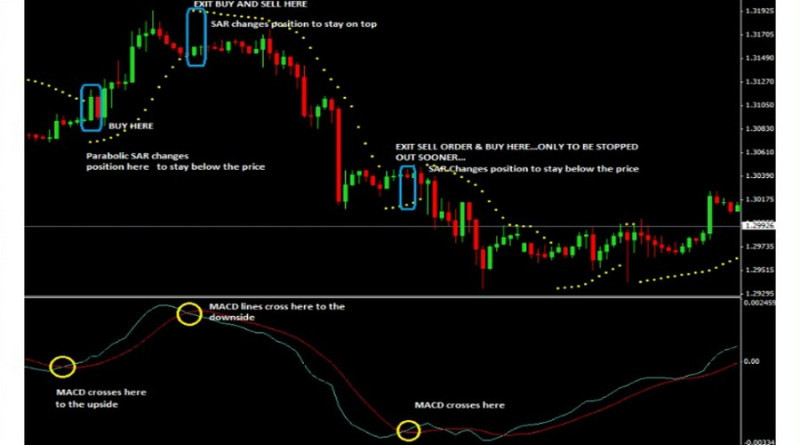
- If you do not use take-profit orders, a trade should be closed when a signal opposite to the one used for entry appears. An example is shown in the screenshot.
Conclusion
At first glance, the Good Martin strategy may seem complicated. Such a conclusion is quite logical because the strategy consists of two indicators and the Martingale strategy.
All these components effectively complement each other. They help traders to determine the best entry and exit points, sort out the false signals, and cover the losses.
At the same time, one should not forget about the two most important risks when trading with Kind Martin. We are talking about the use of time frames below M15 and trading during a flat.
Compliance with the rules, which we described in the article, will help you achieve your goals and minimize the potential risks.
You may also like:
Support and resistance trading strategy


