


The strategy was developed in the 1990s by American trader Bill Williams. Let’s explore the Forex Alligator strategy and see how it is used in trading.
Learning a strategy becomes much easier if you can associate it with an item or a living creature. For example, the Alligator indicator resembles the behavior of an alligator.
What trading signals it generates? Why is it useful and how to read the market based on the alligator indicator lines? Find answers to these questions in our article below.
Read more about other trading methods on Forex in our article Forex Strategies.
Understanding Forex Alligator Strategy
The Alligator strategy is a very popular trading method used by forex traders. It can also be applied to other markets which we will discuss later.
The Alligator indicator was discovered by American trader Bill Williams who first wrote about it in 1995.
The main purpose of the strategy is to identify the start or the end of a strong trend movement in the market.
The strategy is based on the idea that knowing market psychology guarantees success in trading. By understanding the behavior of market participants, you can easily spot accumulation areas and find exit points.
So, the indicator makes it possible to open a trade at the beginning of the price momentum or at the peak of the trending price movement which increases the chances of getting profit. So, this is what Mr. Williams intended to achieve when creating this indicator.
The main purpose of the Alligator indicator is to determine the stages that the market is going through. By observing the past performance of the market, Bill Williams came to the conclusion that markets tend to move in cycles, resembling the behavior of an alligator who sleeps and then hunts.
When the market is trading flat, indicator lines look like a closed jaw. This means that the alligator is sleeping. The longer it sleeps, the hungrier it becomes, meaning that the momentum will be really strong after it wakes up.
When the alligator opens its jaws, it means it has woken up and is ready to hunt.
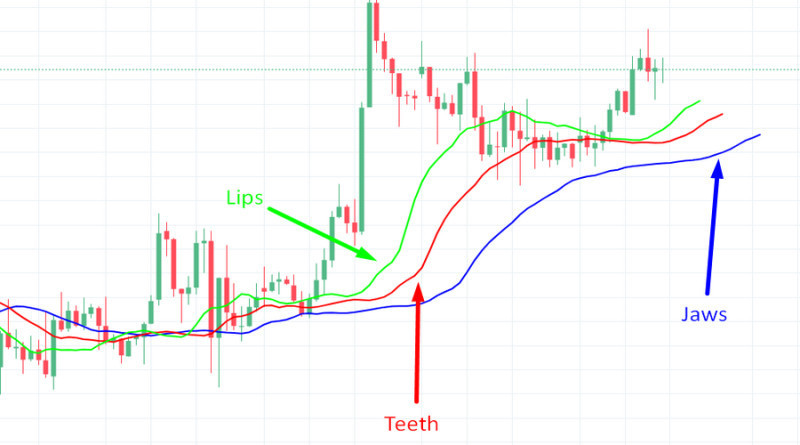
The indicator consists of three smoothed moving averages:
1. The Jaw is a moving average with the longest period of 13 which is shifted forward by 8 bars. This blue line reflects the value of an asset at the time when the market is quiet and there are no macroeconomic events in sight.
This is the strongest element of the indicator. Its breakout means a reversal in a trend.
2. Teeth are represented by the 8-period moving average smoothed by 5 bars (candlesticks). This line is usually red on the chart.
3. Lips are displayed by the 5-period moving average shifted forward by three bars. This is the fastest MA colored green.
All periods of the moving averages are good for trading on the H4 and higher time frames. They are set as default on most training platforms. You can adjust these parameters if you wish.
All the above-mentioned lines are calculated based on the median price of an asset and are also called balance lines. By analyzing the combination of all the elements, you can identify the current state of the market.
If all three lines are located at one level, moving almost parallel to each other or intertwined, it means that the alligator is sleeping. This is also an indication of a weak trend that may change in the near future.
But at the moment, traders should avoid entering the market.
This stage is usually preceded by the “saturation” phase which is reflected by the teeth line. In this case, the red line moves closer to the lower boundary of the price range, meaning that the alligator is closing its mouth and hiding its teeth. This is a clear sign that the trend momentum is exhausted.
When the lips and teeth lines move upwards from the jaw, the alligator opens its mouth and is ready to hunt. In other words, a new trend is being formed.
On the chart, the green line (lips) is located closer to the price level, the red line (teeth) is in the middle, and the blue line (jaw) is the furthest one.
A trend is confirmed or is nearing its peak when the teeth line is crossing the lips line. We will talk about trading signals in more detail later on.
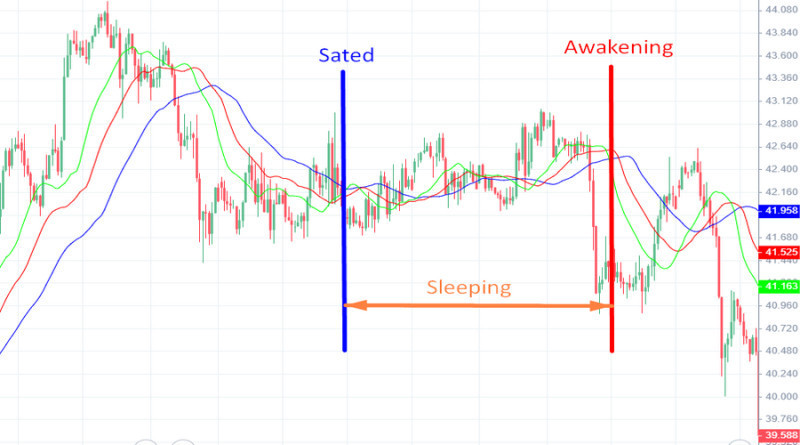
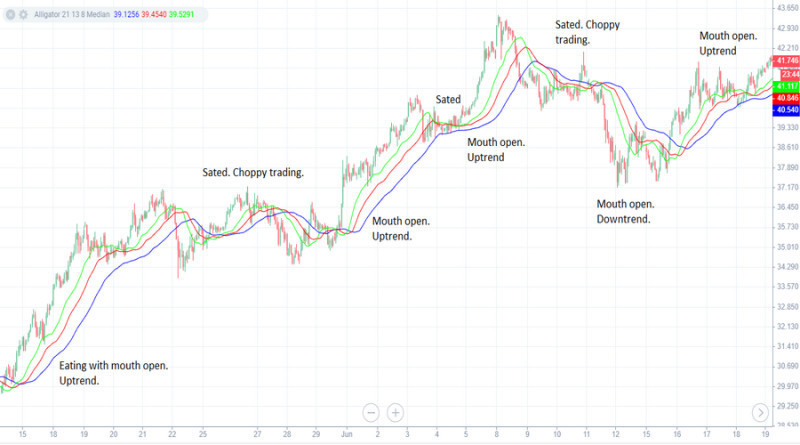
In other words, the alligator is acting in a certain sequence. When it sleeps, all lines are crossed.
Then it starts yawning, that is, it opens its jaws, and the lips line starts moving. Then the hunt begins. The predator eats until it is sated and goes to sleep.
The market functions in a similar way: 70% of the time it is sleeping and 30% of the time it is trending.
See the stages of the Alligator indicator in the picture below.
Key takeaways:
- The Alligator strategy is suitable for defining different stages of the market. Based on this data, traders make entry and exit decisions.
- The Alligator indicator is composed of three moving averages of different periods. Each of the lines represents parts of the alligator’s mouth (lips, teeth, and jaws).
- If the mouth is closed, the market is trading flat, and when the jaws open up, new momentum is emerging.
- The direction of the balance lines shows the nature of the emerging trend. The lips line, or the fastest MA out of the three, is the first to react to the coming momentum. The other two elements line up with it.
- The longer the market is sleeping, the stronger the new trend will be.
- If all three lines uncross and move downwards, the market is in a downtrend. If the lines widen and move upwards, there is an uptrend. When lines start to uncross, it is the right moment to enter the market.
- When the elements are moving closer together and stop moving in one direction, it is the right time to lock in profits.
Trading signals
With the help of the Forex Alligator strategy, traders can define the current stage of the market. It can either trade flat or develop or lose momentum.
The emergence and the end of momentum are the key stages where entry decisions should be made.
All signals generated by the Alligator indicator come from three stages:
1. Sleeping. At this stage, all three MAs are intertwined and are moving horizontally in one direction.
The market is flat, but large market players are beginning to show activity. See the graphical representation below:
2. Awakening. At this stage, we can see that the asset’s price begins to change. The jaw line moves higher, crossing the price level.
The alligator is fully awake when all three MAs move above or below the price level and have the same direction. This is the right time to enter the market.
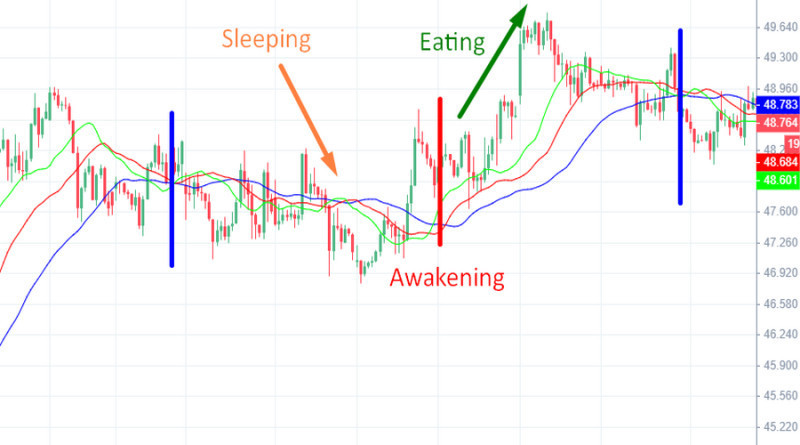
3. Hunting and eating. Now the alligator is eating with its mouth wide open, and the three lines begin to move apart.
On the chart, this is displayed as a clear strong trend (ascending or descending). The trend momentum depends on the sleeping phase. The longer the alligator has been dormant, the hungrier it is, and the longer the hunt will be.
If a trader missed the moment to open a position at the formation stage of a trend, they can do it now but with fewer opportunities for gains.
4. Saturation phase. The balance lines of the Alligator indicator cross again and stop moving with the trend, signaling the right moment to take profit.
Using Alligator indicator in trading
The first line that reflects a change in the market balance is the lips line. When it crosses slower moving averages, this means that new momentum is being formed.
Later, the slower lines also follow the direction of the fastest MA, and this is a good time to look for an entry point.
According to the general rule, an entry signal comes when all three balance lines cross above or below the price level. If they cross it from below, it is time to buy an asset, if they cross it from above, it is the right moment to sell.
It is up to a trader which of the MAs to use as a reference line when looking for an entry point. Those who prefer a conservative approach should use the slowest moving average, that is, the jaws represented by a blue line.
Those who are more into aggressive trading should enter the market at the green line (the lips). For moderate risks, enter the market at the red line (the teeth).
Before deciding on a short or long trade, it is essential to identify the direction of the trend. An uptrend is confirmed by the green line being above other lines and the blue line staying below. At the same time, all three lines should be moving upwards and apart from each other.
A downtrend is confirmed by the blue line being above all other lines and the green line staying below. All three moving averages should be sloping downwards and widening, moving apart from each other.
The basic strategy rules are as follows:
- Open a buy position when the candlestick bar crosses above the MA you chose as a reference line. The bar should close above the crossing point;
- Open a sell position when the candlestick bar crosses below the MA and closes under the crossing point.
Set a stop-loss order at the nearest high or low and a take-profit order - at the tested extremum points.
Experienced traders close trades at the moment when the Alligator indicator generates a signal opposite to the one that was used for entry. The thing is that the price does not always manage to reach the set take-profit level. You need to keep this in mind when looking for the opportunity to close a trade.
For example, if the alligator is suddenly going to sleep, do not take the risk and close the trade as soon as possible. If this turns out to be a temporary correction, and the price resumes its previous movement, you can always open another trade.
You should also consider closing a trade when the price breaks through the blue balance line. This can be a signal of an upcoming reversal.
If so, the moving averages will start to realign according to the emerging trend, and traders will need to adjust their strategy as well.
On higher time frames, the price of an asset can often reach the key levels. If the price change exceeds the average daily range, a trader can close positions manually.
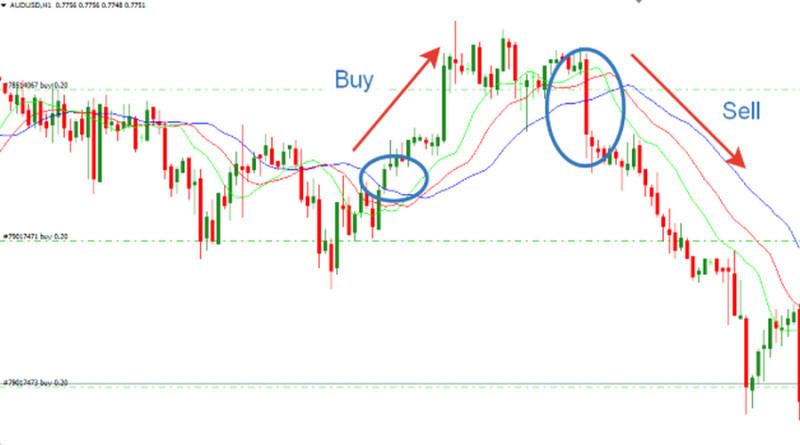
Example of Alligator indicator trading
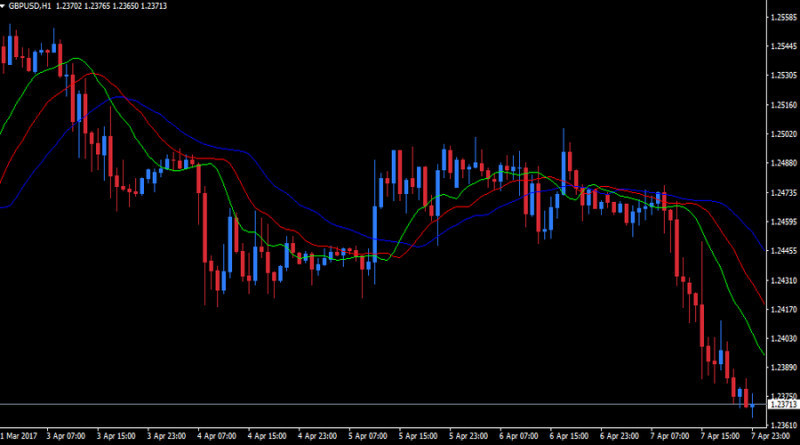
In the bottom left corner of the chart below, we can see that the alligator is waking up and the bullish momentum is emerging. Given the location of all three MAs, a trader should open a long position as quickly as possible.
A bit later, the H1 chart shows that the price begins to test the teeth and the lips lines but the trend remains up. Then the price breaks below the lines and retests the swing low.
At this point, a trader should take profit as all the signs indicate that the alligator is now sated and is going to sleep again. Indeed, the market begins to trade sideways, and traders had better stay away from the market.
Then the beast comes into the awakening phase once again, and we can see a new uptrend on the chart. It is possible to go long when the following conditions are met:
- The lips line is above the teeth line, while the blue (jaw) line is below them all.
- The asset is trading above the balance lines.
The price goes up, just like the opportunities for profits. When the price hits the highest point, it begins to move sideways again. The lips line crosses below the teeth line and the jaw line which is a signal to close a trade.
Another awakening of the alligator comes when all three lines begin to widen and move apart from each other. The price is now below the MAs that commence a downward movement. This is a good time to open a sell trade.
The hunting phase does not last long, and the balance lines cross again and move in the opposite direction. At this point, you can take profit and monitor the situation.
At the far right of the chart, the alligator is opening its mouth again. This is the signal for opening a buy position right after the sell position was closed.
In all the examples discussed above, the stop-loss order should be placed beyond the nearest highs and lows, while the take-profit order should be set near the extremum points. As a rule, the distance between the entry point and the take-profit level is twice as long as the distance between the entry point and the stop-loss level.
Basic rules
The Forex Alligator strategy can be utilized by both beginners and experienced traders.
Novice traders are recommended to follow some basic rules to be more confident with the strategy:
1. The best time frame for this strategy is H4 and above. Those who trade aggressively sometimes use the 30M time frame. This approach increases the risks due to market noise. At the same time, thanks to ample trading signals, the opportunities for profit also increase.
It may not be a good idea to trade on a time frame higher than D1. It may take too long to get a signal on a weekly chart.
2. You can customize the parameters of the moving averages in the settings if your trading system requires this. Just make sure that the ratio of the shifts between the lines remains the same. Otherwise, the indicator will generate false signals.
3. The strategy can be applied to any market including Forex, cryptocurrencies, commodities, and other assets.
4. You can combine the signals and open positions at the jaw line while closing them at the lips or teeth lines.
5. To confirm the signals, use additional technical tools such as the Stochastic Oscillator, the fractal indicator, and others. By the way, the latter was also invented by Bill Williams.
6. The balance lines can be used for finding entry points as well as for setting a Stop Loss. Most often, the Jaws are used for this.
Other options are also possible but with certain things to consider. For example, if you choose a blue line for setting a Stop Loss, your deposit may slip into the red by the time the order is triggered.
If you choose the green line, you may exit the market too early and, therefore, miss a potential profit.
7. It is important to keep in mind that the Alligator indicator generates lagging signals which means that a strong and clear trend is required to follow this strategy.
8. For eliminating false signals during a correction phase, we recommend using the RSI indicator.
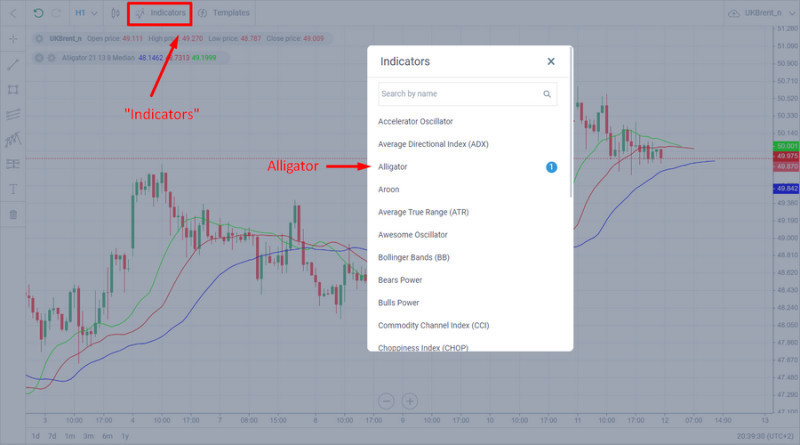
The Alligator indicator is a built-in tool on the MetaTrader platform. Just find it in the Indicators folder and apply it to the chart.
Pros and cons
Bill Williams' Alligator indicator provides a useful technical tool for spotting a trend. The indicator is chosen by many traders mainly because:
- it helps recognize the formation of a trend;
- it shows support and resistance levels;
- it displays a sideways movement and an upward or downward dynamic as well as the beginning and the end of the trend. This makes it possible for a trader to enter the market at the best possible moment, that is, at the start of the trend formation;
- it is easy to use and suitable for beginners;
- it is a default indicator on many trading platforms including MetaTrader;
- it can be used for trading almost any asset.
However, the Alligator indicator should not be considered a standalone tool as its signals must be confirmed by other indicators such as fractals, volume indicators, oscillators, chart patterns, and so on. This is the biggest limitation of the strategy that should be kept in mind.
There are some other disadvantages as well:
- When you change the time frame, you also need to adjust the parameters of the alligator’s moving averages;
- The Alligator is a lagging indicator which is a common feature of all trend-following indicators. The thing is that a trading signal appears when the price has already passed some distance in line with the trend. This is why a trader risks opening a position at the peak or the end of the trend;
- The method is useless during a trendless market phase. As we have mentioned above, according to Bill Williams, the market remains flat for about 70% of the trading time.
Combining Alligator indicator with other tools
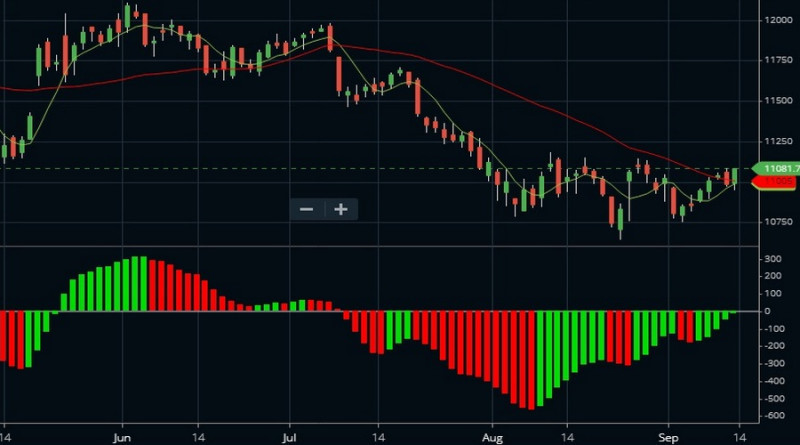
The Alligator indicator can be used as a separate tool but it is better to combine it with the Awesome Oscillator or the fractal indicator.
The AO indicator is displayed below the main chart and is presented in the form of a histogram with many bars. This oscillator allows us to recognize the current trend and the moment of its reversal.
When the market is bullish, the bars are green and they are gradually rising. When the market is bearish, the bars turn red and become shorter.
The fractal indicator identifies potential turning points on the chart and marks them with arrows.
Both indicators come by default with МТ4 and МТ5.
Short positions can be opened when the following conditions are met:
- The moving averages of the Alligator indicator start to move apart from each other and are sloping downwards.
- The bars of the Awesome Oscillator indicator go below the baseline and turn red.
- The price level crosses the nearest fractal situated below the three lines of the Alligator.
A stop-loss order should be set at an opposite fractal that is located above the MAs. If later the teeth line reaches the entry point, you can set the Stop Loss to breakeven.
To exit the trade, wait until the price changes its direction and the bar closes above the lips line. Another option is to close a position as soon as the first green bar appears in the histogram.
Long positions can be opened when:
- The Alligator lines move apart and turn upwards;
- Histogram bars rise above the baseline and turn green.
It is advisable to go long when the price is crossing the nearest local level. In this case, a stop-loss order should be placed beyond the opposite fractal found below the MAs.
If the price moves steadily upwards, you can move the Stop Loss to breakeven.
Set a Take Profit at the teen line. If the bar closes below this balance line, you can take profit.
When the value of an asset rises rapidly, you can exit the trade as soon as the first red bar of the histogram appears. In this case, you won’t lose profit during a correction.
Conclusion
The Forex Alligator strategy which is based on the Williams Alligator indicator is a useful technical analysis tool. It implies opening positions only when the market is trending (upward or downward). So, a trader does not need to constantly monitor the price and devote too much time to trading.
To make the trading process more efficient, traders need to know how to filter out some false signals that can be generated by the Alligator indicator. This can be done with the help of other indicators that we have mentioned in our article.
Although the strategy is rather easy to use, beginners may want to test it on a demo account first. You can open a demo account with InstaForex.
You may also like:
Support and resistance trading strategy


