


A trader’s actions in the market must follow the chosen strategy in order to be profitable. The trader must know when to enter and leave the market and when to abstain entirely.
The article “Forex Strategies” contains all the information about different trading strategies as well as frequently answered questions.
This article will explain trading using the Bollinger Bands indicator, which is suitable for novice traders. Furthermore, it will cover methods used by professional traders, the components of the indicator, the ways to use it when trading various assets, and additional instruments that can be used with it.
About the indicator
The Bollinger Bands indicator has been widely used since the 1990s. It was developed by John Bollinger, an American analyst, over a period of about 10 years.
Bollinger decided to combine a trend indicator, an oscillator, and a volatility algorithm in a single instrument. This approach makes the Bollinger Bands more informative than many other indicators.
By using this indicator, a trader can receive the following data:
- Current trend and trend reversals.
- Price correction zones.
- Short and long-term highs and lows.
- Price levels that are used to predict a trade’s potential profit.
The indicator is plotted directly on the chart and consists of three lines. The calculations behind them are fairly complex, but traders do not have to understand the formulas used, as all lines are plotted automatically by special programs.
The SMA lies in the center and usually has a period of 20. The Close price of an asset is used for the calculation: the values of all closing prices over the last 20 days are summed up, after which the resulting number is divided by 20.
The Open price or an average value specified in the settings can be used instead of the Close price. However, it does not greatly affect the strategy's efficiency, which is why traders generally use the default Close price instead.
The main purpose of the SMA is to filter market noise and determine the price trend. It allows discerning at a glance the direction of the asset's movement.
There are two more linear elements on either side of the central line. These are the moving averages of the first line, but offset by several standard deviations upwards and downwards.
The deviation phase shows how much the asset's price deviates from the average value. Therefore, when an asset is near the upper line, it is considered to be overbought, and if it is near the bottom line, it is commonly referred to as oversold.
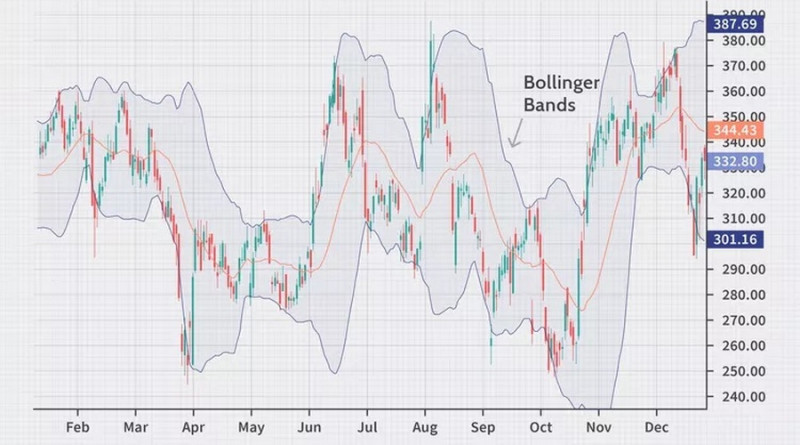
The bands of the indicator form a price channel which reflects the volatility of the asset. When the market is stable and volatility is low, the channel is narrow, and vice versa.
Volatility generally increases sharply during the release of macroeconomic data and other important financial news. Therefore, it is particularly important for traders to use an economic calendar, such as the one which can be found at InstaForex website.
By analyzing the width of the range, the trader can track the volatility dynamics over time, as well as whether the asset is overbought or oversold. Furthermore, the indicator shows potential price moves.
Key conclusions:
- Bollinger Bands are a universal instrument which is popular not just among individual traders, but banks, hedge funds, and other major players.
- The asset’s price remains within the range formed by the outer bands of the indicator 90% of the time.
- The indicator provides users with a lot of key information, allowing market participants to find the best points for opening and closing positions.
- The Bollinger Bands indicator can be used on its own and alongside other indicators.
- By using this instrument, a trader can determine the trend, its strength, the level of volatility, as well as overbought and oversold zones.
- When the asset frequently touches the lower band, it is likely oversold, and if it tests the upper band repeatedly, it is overbought. Traders should plan their actions accordingly.
Market phases
Both intraday traders and long-term investors can use Bollinger Bands Strategy for trading. Nevertheless, it is important to understand what market phases are represented by the indicator.
It can be a correction, a clearly defined trend, and the beginning and end of these phases.
• When the market is flat, the central band moves almost horizontally, while the other two are parallel and may come closer together. The channel at this point is not wide and the price of the asset remains constantly within it, sometimes touching the upper and lower bands. In this case, market participants can trade on the rebound from its support and resistance, which are represented by the boundaries of the range.
• If the outer bands on the chart begin to drift away from each other after a sideways trend, it means that a new trend is taking hold. At this point, it is safe to enter the market to maximize potential profits,
• During a steady trend, the range is wide, with one of its boundaries (upper or lower, depending on the trend's direction) being frequently breached by the asset. The middle band at this time is clearly moving upward or downward.
In this case, the middle band serves as support or resistance for the asset, and not the opposite boundary. The greater the number of bounces off that level, the stronger the trend.
• When the movement of the central band becomes less sharp and the range becomes narrower, this means the trend is fading. During this period, the asset frequently breaks through the middle band, which can be regarded as a signal of a sideways trend.
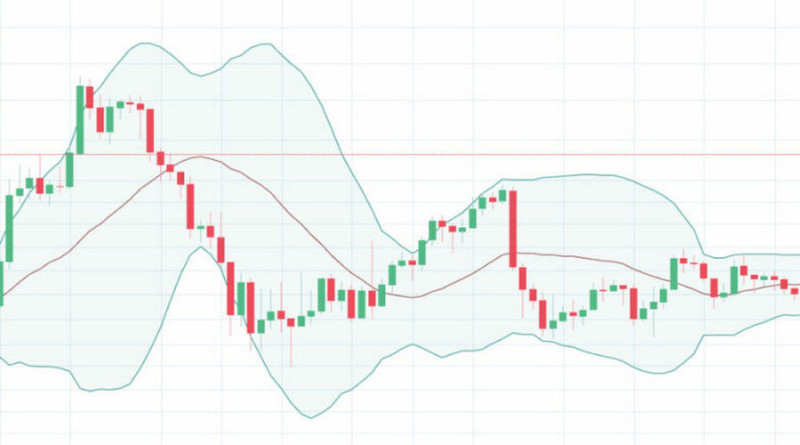
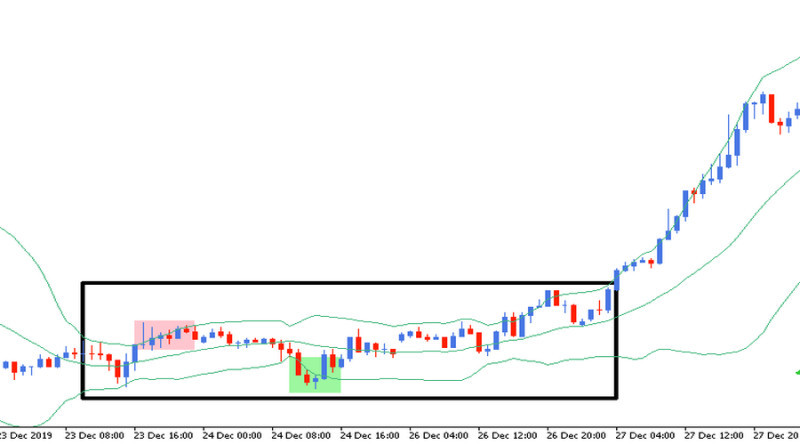
All the stages mentioned above can be seen on the chart below.
How to read the indicator
Here is an example of how to use the Bollinger Bands strategy in practice. We will determine market phases on the chart below.
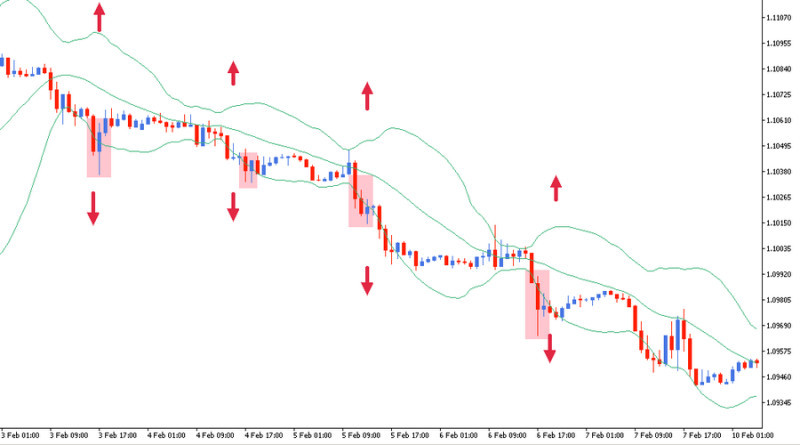
When the range widens, a new trend begins. Its formation is confirmed by the price crossing the lower band.
On the chart, breakdowns are marked with pink rectangles.
To verify the direction of the trend, you need to look at the direction (up or down) of the middle band. The screenshot shows that it is pointing downwards, which means that this is a downtrend.
In the case of a bullish trend, the price would have crossed the upper band instead of the lower one, and the middle band would have been pointing upwards.
The beginning of the trend is particularly important for traders because it is the best time to open positions. If there is a bullish trend, buy orders are placed, and if there is a bearish trend, sell orders are placed.
When the bands begin to converge and all lines subsequently move almost parallel to the horizontal axis, it means the market is flat. In this case, the boundaries of the range act as local support and resistance levels.
In such a situation it is possible to do bounce trading, but this strategy is more suitable for experienced traders than for beginners.
Since the Bollinger Bands indicator may not generate very reliable signals, additional tools can be used to test it. For now, let's focus on chart patterns.
There are a lot of patterns, yet they can be roughly divided into two groups: W-patterns and M-patterns.
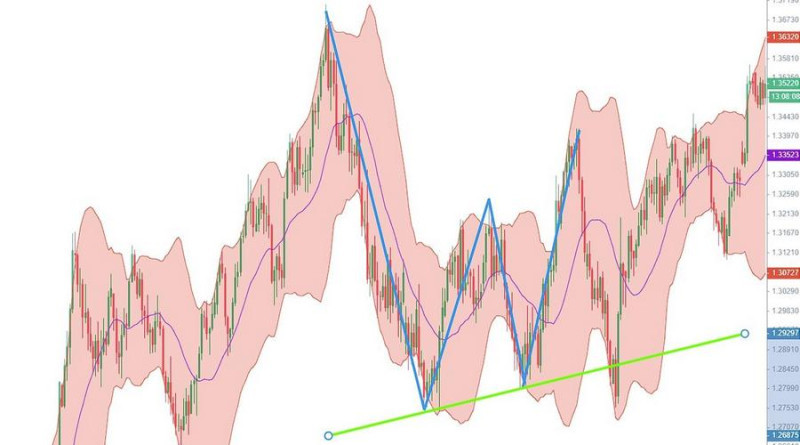
W-patterns signal a bullish trend. The pattern does not have to be perfectly shaped, however it should visually resemble the letter W.
The market sentiment can be determined from the shape of the pattern. For example, if both parts of the pattern's base are on the same level, the market is calm.
When the right element is located below the left one, traders are cautious when opening long positions and feel uncomfortable. Some of them possibly had losses at the previous low.
Very often the left side of the W-pattern touches the lower boundary of the range formed by the Bollinger Bands Strategy.
The screenshot shows a W-shaped pattern with the right low being higher than the left low. At the same time, the base of the pattern crosses the lower boundary of the Bollinger Bands at approximately the same level.
How should a trader act in this situation?
Professional traders recommend opening long positions after a candlestick with above-average volume and range is formed.
In this case, the Stop-Loss order should be placed below the pattern's right side low. Later, when the price starts to move according to the forecast, the order can be moved up.
M-patterns visually resemble the well-known Head and Shoulders pattern.
If you analyze this pattern on the chart, you will see that the price increases rapidly at first, reaching its high, and then rebounds. The second part of the pattern is shaped similarly.
There can be not only two, but also three or four such spikes. After them, a steady downtrend is established.
Again, the trend shape may deviate from ideal proportions.
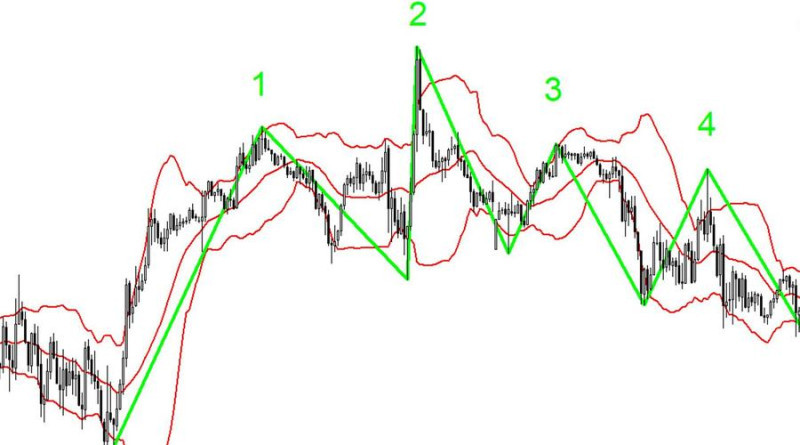
By analyzing the pattern's interaction with the Bollinger Bands, traders can find the optimal market entry point. Most often short positions are opened at the top of the right peak ("shoulder"), which according to the strategy allows getting maximum profit if the asset drops further.
Using Bollinger Bands strategy with RSI
As stated above, Bollinger Bands can be used both separately and together with other algorithms. It is most often used with the Relative Strength Indicator, which acts as an oscillator.
The purpose of the RSI is to filter the signals coming from the Bollinger Bands. As a result, it increases the effectiveness of trading, even though fewer trades are made.
While implementing this strategy, traders should focus on two things: the position of the price relative to the Bollinger Bands and the RSI level.
When implementing the strategy, a trader may be guided by signals indicating the following:
- buying an asset if its price breaks through the lower boundary of the range while the RSI does not exceed 30. All these signs indicate that the asset is oversold;
- opening a short position when the asset breaks above the upper line of the range from the and the RSI exceeds 70.
Both indicators come pre-installed with MetaTrader, so you do not need to download and install them to the platform to use the strategy. You only need to find them in the indicator list and add them to the chart.
Entry points into short and long positions are marked on the screenshot by red and green icons, respectively.
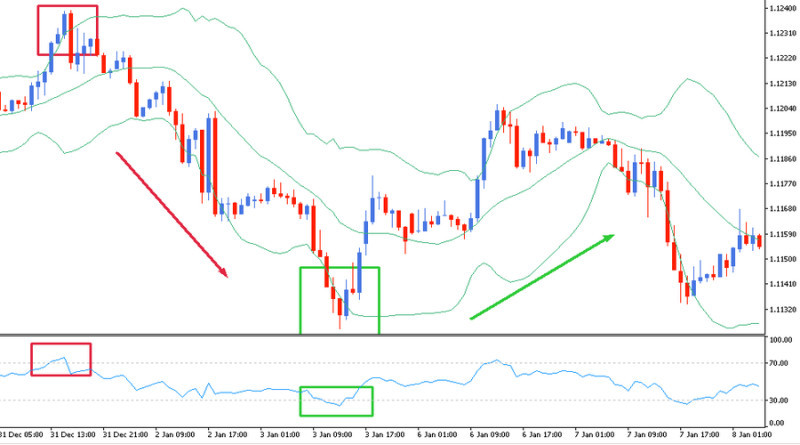
These are the main signals created by the Bollinger Bands and the RSI. In addition to them, the indicators also generate additional signals, which can make trading more efficient.
For example, a trend reversal may be indicated by the Relative Strength Index crossing the 50 level or when the asset crosses the middle band of the Bollinger Band indicator. Furthermore, the RSI is quite often used to identify divergences.
This strategy is especially effective for relatively long-term trades. For example, if a trader uses 5-minute candlesticks, the duration of trades should be at least half an hour.
Using both indicators works with all assets, particularly when trading currency pairs. Such assets are very sensitive to fundamental factors, and it is very easy to find the best entry point just before the release of macroeconomic news.
This strategy requires placing Stop-Loss and Take-Profit orders. Their sizes depend on the chosen timeframe.
For example, for the H4 time frame, Take-Profit orders should be set about 200 pips away from the entry point, with the Stop-Loss order set at half that distance. Later on, the Stop-Loss order can be moved to breakeven.
However, this is only a suggestion, as stop-loss orders should be set for each asset individually. Furthermore, its size depends on whether you are using conservative or aggressive trading tactics.
Double Bollinger Bands strategy
The Double Bollinger Bands trading strategy was created by trader and book author Kathy Lien. She recommends using this strategy when trading various assets, such as currency pairs, equities, commodities, etc.
The strategy is used as follows:
- Find the Bollinger Bands in the indicators list and add them to the chart.
- In the indicator’s settings menu, the SMA is at 20; the outer bands should have the default standard deviations.
- Add another Bollinger Bands indicator with a different color. It can be selected in the indicator’s settings).
- The SMA should be the same, but the standard deviations should be set at 1.
In the screenshot, the bands from the first indicator are labeled A, while those from the second indicator are labeled B. The central SMA is X, and it remains the same for the two indicators, because it has the same period.
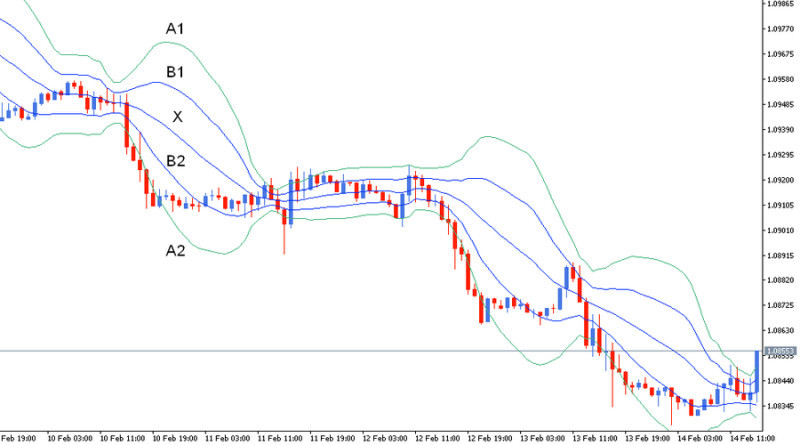
The resulting areas are important reference points for the trader. The outermost areas are particularly significant, while those surrounding the SMA on both sides are considered to be neutral.
When the price of the asset stays in the area between A1 and B1, it means that it has great upside potential and will likely continue to rise. In this case, you can open long positions or hold the ones you have already opened, as long as the asset does not leave this area.
If the price is located between the A2 and B2 lines, it means that the bearish trend will continue. At this point, traders should sell the asset because it is likely to fall in value in the future.
When the price moves within the neutral zones, it indicates a flat or a weak trend. In this case, it is necessary either to abstain from trading or to trade short-term trends within the indicated range.
Generally, this strategy involves trading the bounces from support and resistance levels, which in this case are located at the outer Bollinger Bands.
Using Bollinger Bands for scalping
Traders that seek quick profits can use Bollinger Bands for scalping. This strategy takes advantage of three other indicators besides the Bollinger Bands:
- Awesome Oscillator, which shows market sentiment and the trend’s strength.
- The Relative Strength Index (RSI);
- The Exponential Moving Average (EMA), which is used for determining the trend’s direction.
The Bollinger Bands are set up with period 14 and deviation 1. The periods for RSI and EMA indicators are 14 and 4, respectively. This strategy can be used in time frames between 1 and 15 minutes.
Long positions can be opened if the following conditions are met:
- EMA (marked black on the chart) breaks above the middle band of the Bollinger Bands (marked blue on the chart).
- The Awesome Oscillator is above zero.
- The RSI surpasses 50 and moves upwards.
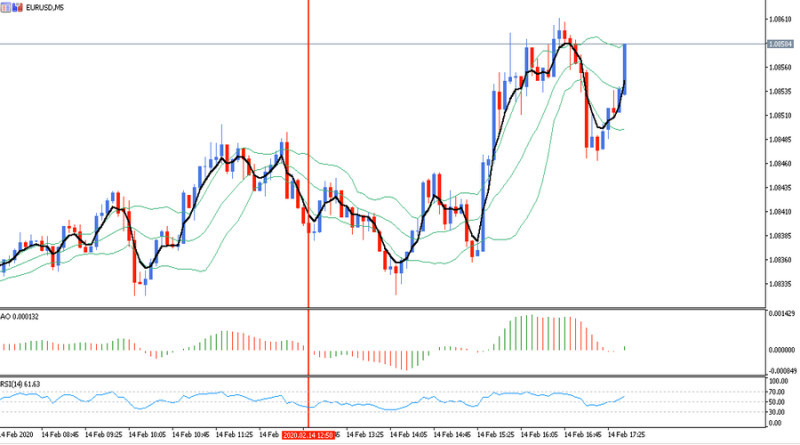
In the screenshot, possible entry points under this strategy are marked with red vertical lines. Exiting the market can be done when opposite signals appear.
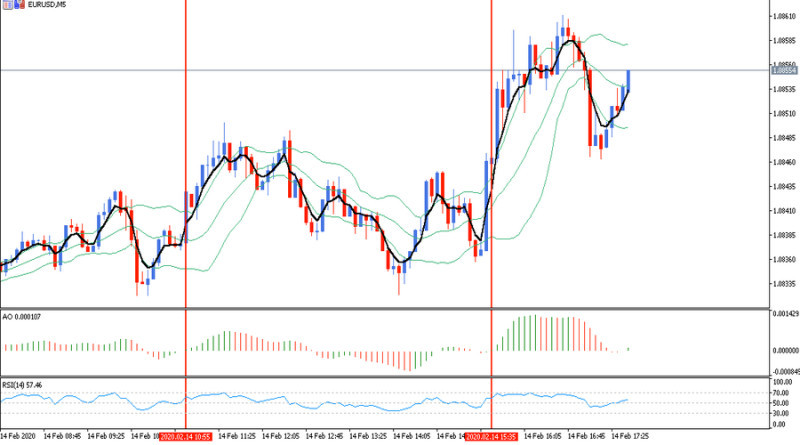
Short positions are opened in a situation that mirrors the previous scenario:
- EMA breaks below the middle band of the Bollinger Bands.
- The Awesome Oscillator is below zero;
- The RSI reverses course and moves below 50.
There is also another notable strategy that is popular among scalpers. It can be difficult for beginners because it uses a lot of indicators, but it is quite suitable for those who have already learned the basics of forex trading.
This method uses three sets of Bollinger Bands at once. All have the same period of 50, with deviations set at 2, 3 and 4, respectively.
The RSI has a period of 8, while the Moving Average has a period of 50. Stochastic is also used in this strategy with parameters set at 14, 3 and 3.
Thus, this strategy uses four indicators simultaneously. Some of them are located underneath the chart, so it will not be overloaded.
This strategy works best in M1 and M5 time frames, although traders often use M15 as well.
Long positions should be opened when:
- The asset breaks below the Bollinger Band with a deviation of 2 and crosses at least half the distance towards the lower band of the indicator with the deviation of 3.
- RSI and Stochastic can be used to confirm the signal. The first indicator must surpass 30, while the second one should be below 20.
Traders can take profit if the asset reaches the Moving Average line.
To open short positions, these conditions should be met:
- The asset breaks above the lower band of the Bollinger Band indicator with the deviation of 2 and crosses 50% of the distance to the upper band of the indicator with the deviation of 3.
- The RSI touches or crosses the 70 mark, while the Stochastic Oscillator remains above 80.
Short positions can be closed once the asset hits the MA line, but scalpers can have different conditions for exiting the market. It all depends on the chosen trading tactics and profit targets.
Conclusion
This review describes the Bollinger Bands indicator in detail. The strategy, which involves using only this indicator, is the easiest to use and can be used by all market participants, regardless of their trading experience.
When the asset is moving within a range, a trader may carry out bounce trading as outer limits of the band represent dynamic support and resistance levels.
If the range widens, it means that a trend is emerging. In this case, traders are recommended to open positions accordingly.
These are only general rules for using the Bollinger Bands Strategy, details on the entry and exit conditions are described in the article.
More advanced traders can use the Bollinger Bands together with other indicators, such as the Relative Strength Index, Stochastics and so on. They will help to increase trading efficiency and filter out false signals.
No matter which variant of the strategy you choose, it is better to start testing it with a demo account. Registering a demo account with InstaForex is easy and only takes a few minutes.
You may also like:
Support and resistance trading strategy


