If you only hope for luck when trading, sooner or later this approach will lead not only to disappointment but also to financial losses. If you want to trade with profits, it is crucial that you choose the trading strategy.
The article "Forex Strategies" will help you to understand all the trading strategies and how to apply them. Learn about different options and pick the most suitable ones for yourself.
In this article, we will tell you about the support and resistance trading strategy: a strategy that involves trading on rebounds, breakouts, and retests. Find out why these levels are important in trading, how to build, and use them correctly.
What are support and resistance trading strategy?
Support and resistance levels are one of the most important tools of speculators working in any financial market. They can apply them when trading stocks, currencies, digital assets, and derivatives.
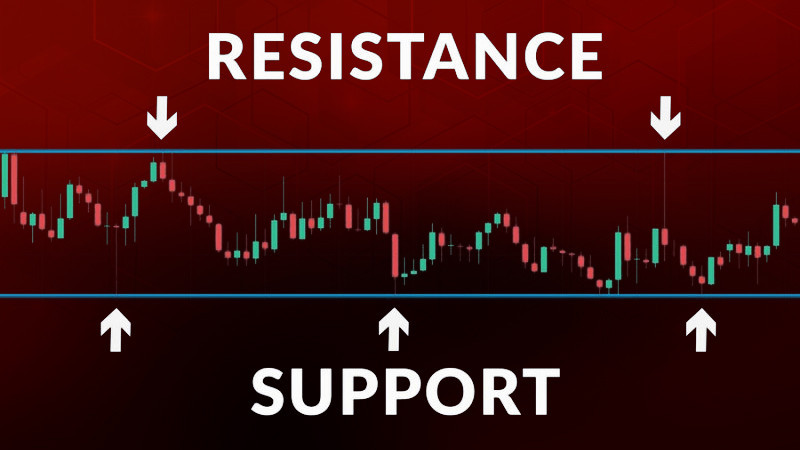
In other words, support and resistance are two foundational concepts in technical analysis. They indicate the level at which the price stops its movement. So, the price may reverse.
When going up or down, the price faces a strong resistance level that does not allow it to move in the same direction. There is a logical explanation for this.
If we analyze price changes of any asset, at first glance it may seem that the price is moving chaotically. However, this is not true.
Gradually rising, the price holds on a certain high from which it subsequently bounces and declines. This level is called resistance.
After that, it is unable to grow because of sellers who enter the market and increase short positions. Bulls, in turn, try to get rid of the asset and do not make efforts to push the price higher.
As a result, high supply and low demand trigger a drop in the asset price.
When on the chart, the price reaches the resistance level, it is time to open short positions. The price is very attractive at this moment. At these levels, traders usually close long positions.
A similar situation is seen on a bearish chart. However, in this case, we are talking about the support level. After reaching this level, the price rebounds and climbs. It boosts the bullish trend. Demand for the asset grows, stimulating its rise.
Bears have to leave the market as it is unprofitable for them to sell an asset at a very low price.
In this case, it is better to open long positions or lock in profits by closing previously opened short positions.
Here are the factors that usually affect supply and demand:
- Important events, news, or the publication of economic reports;
- Actions of crypto whales as well as institutional investors;
- Market sentiment
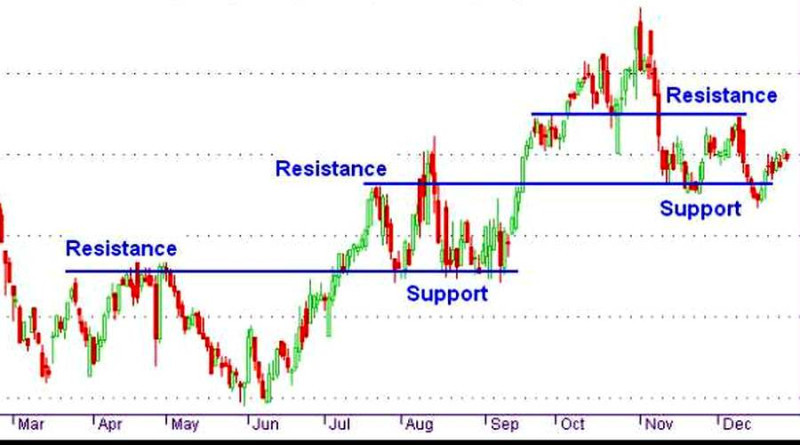
The more times the asset rebounds from Support and Resistance, the more significant these levels become, It means that investors should deem them as key levels.
Firstly, it helps traders predict price changes more accurately. Secondly, the key levels are of great importance from the physiological point of view as many market participants are guided by them.
Apart from that, support can turn into resistance and vice versa. It happens after the breakout of one of the key horizontal zones.
However, breakouts can be false. To exclude such a possibility, it is necessary to wait until the price makes several attempts to break through support or resistance levels.
To build Support and Resistance levels, it is enough to connect the levels from which the price often rebounds. To do this, you can use the wicks of candlesticks or their bodies. It all depends on the preferences of traders and the chosen strategy.
Sometimes it is important to pay great attention not to a level but to a zone. Usually, the price rebounds from a certain range but not a specific level. Therefore, a move by several pips on an hourly chart occurs quite often.
Investors keep an eye on resistance and support levels, especially in times of high market volatility, namely before the release of macro stats.
When using these levels, keep in mind that:
- Any trend and sideways movement ends sooner or later. You should always remember this when using support and resistance levels;
- After testing the zone, the price can bounce off, break through support or resistance, and also make a retest. These are the basic principles of three different strategies;
- Target levels can be used to determine entry and exit points;
- Support and resistance trading strategy become stronger if the price has retreated or rebounded from them many times. The more, the better;
- Pay attention to the timeframe at which support or resistance levels are built. Support and resistance levels are more reliable on the D1 charts and larger timeframes. So, it is recommended to change the timeframes to check the signals;
- After the price has approached Support or Resistance, most often it changes its direction. This is the most common scenario. However, there are also breakouts, including false ones, you need to be prepared for this;
- Zones can be horizontal, upward, or downwards. As a rule, speculators apply different strategies when using these zones. We will tell you about them later;
- Some traders use both zones. However, it requires at least minimal experience working with each of them separately;
- When working with support and resistance, it is important to set Stop Loss orders. Speculators can use both market and pending orders.
Let’s discuss some of the above-mentioned features in detail.
How to apply Support and Resistance trading strategy
Support and resistance levels can be used when working with various assets - currency pairs, shares, cryptocurrencies, and other assets.
In addition, traders can apply them in different market situations: when the price is in the correction stage or moves according to a trend.
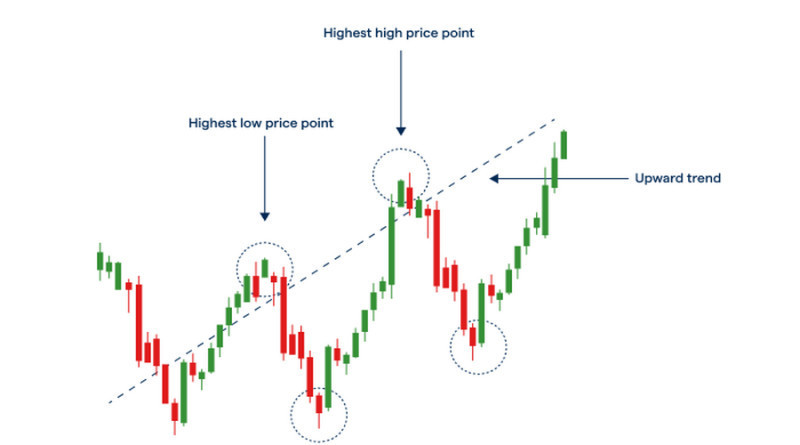
Option No.1: a bullish trend when the asset is steadily rising. If you look at the chart, you can see that the highest and lowest levels of some candlesticks are above the trend line.
It means that in this case, you can look for suitable moments to open long positions within the trend when the price is at a low level. Even if you open a position at a high, you are likely to get a profit.
Option No.2: a bearish trend when the asset, on the contrary, drops. In this case, traders open short positions expecting the price to fall even more.
Option No.3: sideways movement. The price does not have a specific trend. It simply fluctuates between support and resistance.
Usually, scalpers who are interested only in short-term movements enter the market when the price is moving sideways. After the price reaches the upper border, they go short. They open long positions when the price hits the lower border.
As for the market participants who adhere to long-term and medium-term strategies, they mainly focus on the trend. To be more precise, they open positions when the trend has just started.
With this approach, traders need to assess risks and potential profits.
Support and Resistance levels: Strategy No.1
Speculators use support and resistance levels for opening short positions at those moments when the price reaches the resistance zone. They buy the asset when the price touches the support level.
In both cases, they are betting that after testing, the price will rebound and start moving in the opposite direction. Stop Loss and Take Profit orders are placed beyond support or resistance zones.
The price rebound is the most common scenario when it comes to the horizontal zones. However, positions should not be located near support or resistance zones.
Let's give an example. On the chart, you can see the plotted key zones. The price has been moving between them for quite a long time.
In such a situation, a rebound may occur if the price has already bounced at least three times. We are not talking about a specific price level but about the zone.
At the same time, analysts do not recommend opening trades at a time when the price is within the support or resistance zone. The fact is that the price could rebound or even break outs of the zone. So, the trade will be unprofitable.
Therefore, it is better to enter the market when the rebound has already occurred. In other words, long positions are opened in price zones close to the support level and short positions are made near the resistance level.
The distance on the 1H timeframe is usually only a few pips from the corresponding lines.
In both cases, investors open trades after the rebound: the candlestick should be closed below the resistance or above the support. When the price is fluctuating between the levels, it is better not to take any action.
If trading is carried out from horizontal support and resistance areas, chart patterns can be used to increase the effectiveness of the strategy. So, it is necessary to identify the pattern that is formed on the key zone before opening a position.
It can be a pin bar or inside bar.
Now, let's discuss Profit Take and Stop Loss orders.
To place a Stop Loss, you should find the nearest high or low level. To avoid Stop Loss to get triggered by regular market noise, place it slightly above the high or below the low. It depends on the trend.
When placing it, you should also pay attention to the timeframe. For example, if it is 15M and 1h charts, consider placing a profit target of 10 pips. If it is the daily timeframe, it is better to place a profit target of 30 pips
If the asset price moves according to expectations, do not hurry to close the position. It is better to move the Stop order to breakeven and continue monitoring the chart.
No matter how strong the trend is, it will end someday. The more times the price cannot break through the level, the higher the probability of the breakout.
Therefore, if the price has already bounced five times or more, it is too late to enter the market.
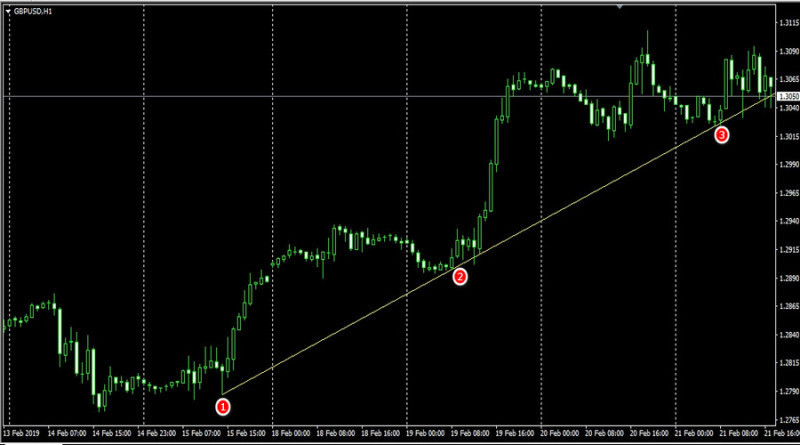
The strategy we have described can be applied both on horizontal charts, channels, and trend lines. In the picture, the entry points into long positions are plotted by circles.
Drawbacks of the rebound strategy
- Incorrect plotting of support and resistance levels means that traders pick wrong entry points. In the best case scenario, this leads to a decrease in potential profits, in the worst case one – to losses.;
- There is no method which can help you accurately determine a rebound or breakout. Traders should always rely on their trading experience and, if necessary, resort to the help of indicators.
Strategy No. 2 Breakout
The name of its strategy speaks for itself. Trades are made when the price breaks through support or resistance and moves without changing its trajectory.
In the first case, we are talking about a bearish breakout and in the second one – about a bullish breakout. Usually, a breakout occurs after the consolidation stage.
On Forex, horizontal levels are most often used for this strategy. At the same time, trading from the borders of channels and trend lines is also possible,
As a rule, a breakout occurs after the accumulation of positions. This is why it is important that you pay attention to such indicators, especially volume ones. The histogram of such indicators will automatically be placed below the chart.
An example of the strategy is shown in the picture. You can see that the price has already tested the support area twice and subsequently broken through it. After that, it continued to move down.
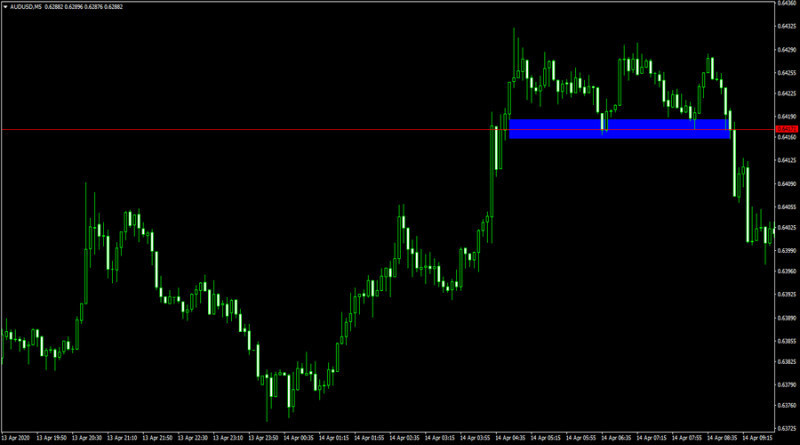
It is recommended to open a sell position if you can see that the body of the candlestick is located below the broken support zone. If we are talking about resistance, the candlestick should be located above it.
It is better to place Stop Loss above the candlestick in the first case and below it in the second one.
The main advantage of this strategy is the opportunity to earn a big profit thanks to a trend reversal. As we have already told, during the periods of intersections, the trading volume increases sharply, which boosts the unfolding trend.
Therefore, a trader who has opened a position at the breakout incur losses. This strategy is most often used only by professionals with extensive trading experience.
To minimize possible losses when implementing a breakout strategy, it is better to trade in small volumes, especially if you are a beginner.
What steps traders should take when using a breakout strategy:
- Identify the trajectory of the price. If it rises, wait for the breakout of resistance, if it drops, don’t miss the breakout of the support level;
- Open a trade after a breakout: buy if there was a breakout of resistance and to sell if there is a breakout of support;
- Place the Stop Loss below the broken resistance zone or above support.
Strategy No. 3: Retest
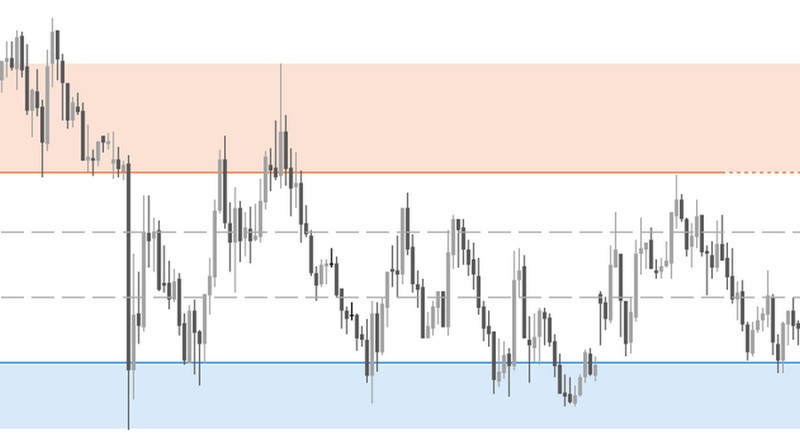
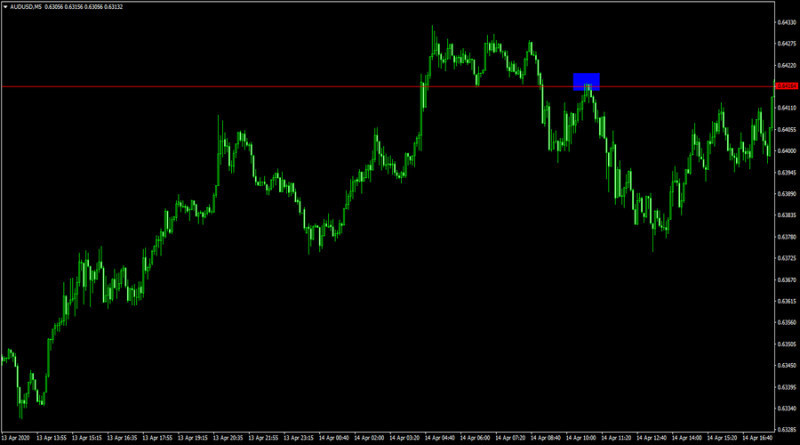
This method is based on the rebound strategy. The only difference is that after the breakout, the asset price returns to Support or Resistance, bounces from it, and then turns around and continues to move.
Such a move is called a retest. On the chart, it is indicated by a blue rectangle. In this case, support turns into resistance.
When implementing this strategy , traders needs to act according to the following plan:
- Chart analysis and expectation of a breakout;
- Determination of a retest level;
- Opening positions according to a rebound strategy;
- Placing Stop Loss above or below the candlestick.
Retest trading involves minimal risks. The fact is that the probability of a false breakout is low. The Stop Loss is not located far. So, you will not incur losses if the price changes.
At the same time, you need to know retests happen oftentimes but not always. There are situations when the price does not return to the breakout level and moves further up or down.
When waiting for a retest, a trader may miss the best moment to enter the market and lose part of the profit.
Analysts recommend to divide the transaction into two parts. One order should be opened on the breakout strategy and the second one – on the retest strategy.
Trading recommendations
There are various strategies based on key levels. Speculators choose which one to use. Some of them combine several strategies.
Here are the main recommendations for using any of the selected strategies:
1. Before opening a position, it would be wise to check the signal on the chart. To do so, use trading volume indicators, candlestick patterns, and so on;
2. Access risks and potential profits. Their ratio should be at least 1 to 3;
3. In order to learn how to build levels, you need practice. To do this, you can use charts of different assets on various charts;
4. If we are talking about horizontal Support and Resistance levels, it is necessary to understand that these are zones, not lines. To build them, you need to measure a certain number of pips from the level. On the H1 chart, 3-5 is enough and on the D1 - 10 more pips;
5. Investors choose a rebound strategy when the price moves sideways. They open long positions when the price is testing support. If the price touches the resistance level, it is better to go long. In the first case, Stop Loss is set several points below the level, in the second one – above it;
6. The breakout strategy is used both at the moment when the price breaks through the horizontal zone and moves near trend lines. Unlike the rebound strategy, traders do not make transactions when the price is testing the level and open positions only after the breakout. They also pay attention to the closing of the candlestick.
Stop Loss is placed below the support or above the resistance levels depending on which one is broken;
7. Use technical indicators, for example, MACD or RSI.
The MACD indicator identifies divergences on the chart. It helps traders find the best entry points for opening positions.
Let's say the divergence occurred near Resistance. It means that it would be wise to postpone short positions.
One should go short only after the price breaks through the pivot level on the histogram. Thus, there are two signals for short positions: a rebound from the resistance and a divergence of the MACD.
The relative strength index (RSI) is a momentum indicator used in technical analysis. It draws all trendlines automatically in the indicator window. Their intersections generate an additional entity point. For example, if the price is trying to break through Support, traders need to wait for the moment when the indicator crosses the trend line. When it happens, you can open a short position.
How to build levels
As support and resistance trading strategy play an important role in the trading, it is crucial that traders identify them correctly. It will help them open a position and close timely.
At the same time, visually the levels can look like the horizontal and trend lines. The first ones are most often used during periods of a sideways trend. They are also called static.
In this case, the price moves within the range. Its borders are the horizontal levels: Support limits the movement of the asset from above, and Resistance limits it from below.
When there is a strong trend in the market, horizontal levels generate very few signals. This is why investors should pay attention to trend lines. They also connect the extremes. As a result, a trend channel appears, not a horizontal one.
Such levels are also called dynamic.
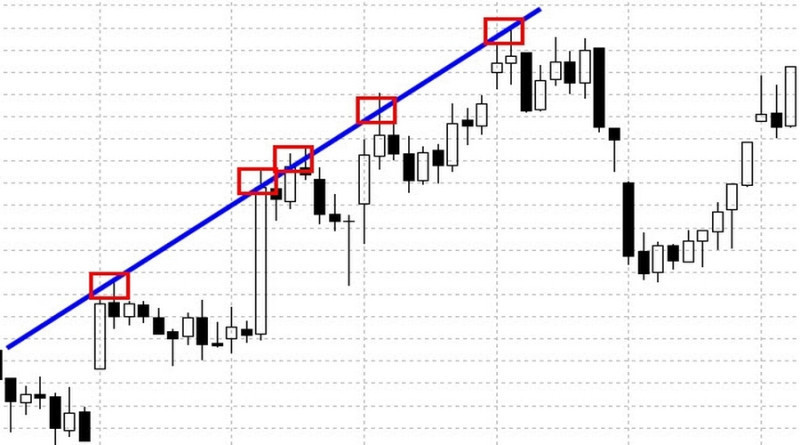
If we are talking about bullish sentiment, support is of the greatest importance. In case of its breakout, a trend reversal is possible. In a bear market, on the contrary, resistance is relevant.
That is why only a trend line is usually added to the chart. If the bullish trend prevails, the support line is plotted on the chart.
When the price declines, the resistance level is added to the chart. In other words, with a bullish trend, the trend line moves below the trend line, with a bearish one – above it.
The principles of trading on horizontal and trend levels are similar. The only difference is that in the second case, speculators have more opportunities to test strategies.
There are also channel levels. For example, Keltner channels can be attributed to this group, as shown in the picture.
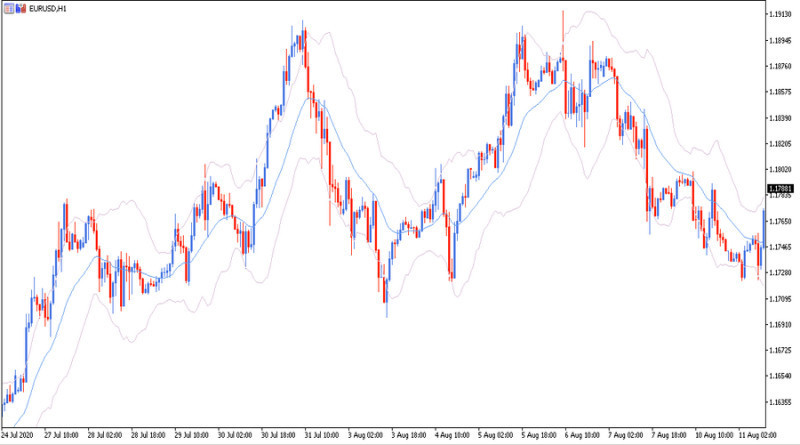
Main features of levels:
1. Round numbers. Quite often Support and Resistance are located at round numbers. From the psychological point of view, traders gravitate towards round numbers when placing top losses and take-profit targets.
As there are many market participants using round numbers, the remaining traders are unable to build other levels;
2. Moving Average.
Those investors who do not want to build target levels use moving averages.
If the trend is bullish, a moving average acts as support and if bearish – resistance.
There are several ways to build Support and Resistance. First, let's talk about how to do it manually.
The easiest way is to find the lows or highs on the chart and connect them together. As a result, you will get MAs.
As we have already told you, you can use not only the Closing price but also the high, low, or a moving average. In order to tailor the levels, you will have to spend lots of time. Besides, for beginners, it may be even more complicated.
Last but no least, it is quite simple to plot horizontal and trend lines on the chart. However, it is much more taxing to add trend channels.
Therefore, speculators use indicators for drawing levels. Here are some of them:
- Support&Resistance;
- ZigZag;
- Zone;
- Lines;
- SupDem.
Conclusion
In our article, we have discussed how to use support and resistance levels correctly. The strategy will become as effective as possible only if Support and Resistance trading strategy are built correctly. This is a key requirement.
Experienced traders will hardly have problems with this. However, for beginners, it is better to use special indicators for drawing levels and learning to build support and resistance on their own.
When investors have no difficulty applying support and resistance levels, it is necessary to determine which strategy they are going to use. This can be a rebound, a breakout or a retest strategy, which we described in detail in the article.
You can combine several strategies depending on the market situation. It would be wise to start using any strategy by testing on a demo account.
Before starting trading, it is important that you remember some facts about the levels:
- If the price breaks through the resistance, then it can become support and vice versa;
- The more times the price touches the level but cannot breaks through it, the stronger the Support or Resistance becomes;
- When a breakout occurs, the strength of the trend depends on how long bulls or bears can protect this level.
You may also like:


 Back to articles


