


Did you know that some of the regularities that exist in nature and architecture also apply to trading? Such patterns include the mathematical sequence of Fibonacci numbers.
This article focuses on how to apply these numbers in trading. The Fibonacci trading strategy has its nuances, as well as advantages and disadvantages, which we will consider in detail.
Suppose you want to get acquainted with other trading algorithms and understand which of them can better suit your abilities and needs. In that case, read the article "Forex Strategies".
Understanding Fibonacci numbers
Fibonacci was a famous Italian mathematician who derived a unique sequence of numbers. In this sequence, each successive number is the sum of the previous two numbers.
All these numbers have a special ratio between them, which is also called the "golden ratio" and is equal to 1.618. It is found not only in mathematics but also in nature, architecture, biology, and trading in financial markets.

All objects with "golden ratio" proportions are considered to be as harmonious and natural as possible. This can be plants, planetary trajectories, natural phenomena, and much more.
The Medieval scientist had no idea about trading. The idea of using Fibonacci numbers was first developed by Charles Dow, who created the Dow Jones Industrial Average.
He noticed that during a directed movement, the value tends to correct a little, i.e. to roll back. This happens, according to his estimates, at levels of 33% and 66%.
Later this concept was refined by Ralph Elliott who introduced more accurate correction levels based on the Fibonacci sequence: 38.2%, 61.8%. He also added another level, 50%, based on the trend of the stocks.
All these ratios are derived by dividing the numbers in the Fibonacci sequence by each other. For example, 0.618 (or 61.8%) is obtained by dividing any number by the next following number, and 0.382 (or 38.2%) is obtained by dividing a number by one from the divisible.
Fibonacci indicators
Based on the ratios of numbers from the Fibonacci sequence, several technical indicators have been created in modern trading platforms for market analysis. The Fibonacci strategy can be based on one of them.
Let's analyze the most important of them using the example of the MetaTrader trading platform. So, six indicators based on Fibonacci are available in the trading terminal under consideration
- Fibonacci retracement levels. Using Fibonacci lines as support and resistance levels make it fairly easy to find corrective movements on the chart. This, in turn, allows you to buy an asset at the lowest price during an upward trend and sell at the highest price during a downward trend.
- Fibonacci extensions include levels above 100%. These include 138.2%, 161.8%, 261.8%, 423.6%, and so on. These levels are used to set profit targets and trade against the trend. According to these levels, you can determine how far the trend can go after the end of the correction period or before the reversal.
- Fibonacci time zones allow you to determine the time for the most successful trading using levels. Unlike the two previous indicators, this tool builds vertical lines, which are also drawn according to the Fibonacci sequence.
- The Fibonacci fan is a tool that draws lines not horizontally but in the form of a fan. In this case, only 3 levels are used: 38.2%, 50%, and 61.8%. If the upward trend is dominating, the fan marks out support levels at which one can buy at a good price. In the case of a downward trend, on the contrary, the lines act as resistance levels, and they can be used to sell at the most favorable price.
- The Fibonacci channel is formed by several lines between which the price moves. All other levels are drawn lower (if the trend is growing) or higher (if the trend is going down). When the chart crosses one of the boundaries, the channel is broken and a potential trend change occurs.
- Fibonacci arcs are drawn as semicircles or ellipses. They allow you to identify price zones below (if there is an uptrend) or above (if there is a downtrend) the current value.
Fibonacci retracement levels
As mentioned earlier, Fibonacci levels are used by traders to determine corrections on the chart. If the price has a directional movement, it is possible to determine its beginning and end.
Between these points, levels, i.e. additional lines, can be drawn on the chart. When these levels are reached, the chart can make small corrective movements before continuing the movement in the previous direction.
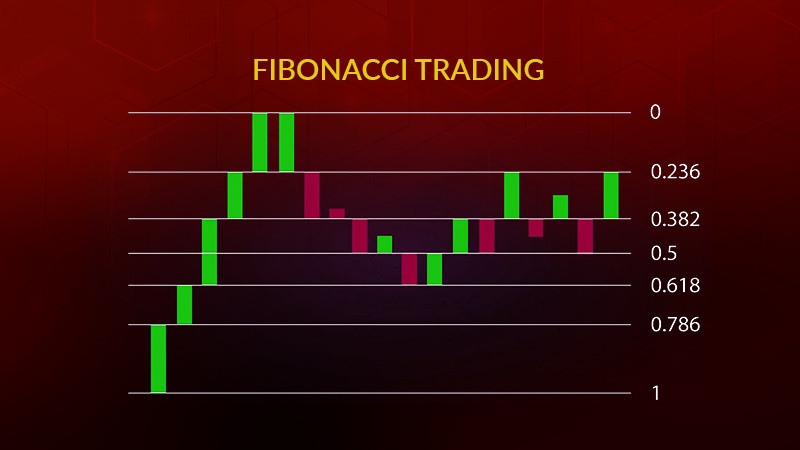
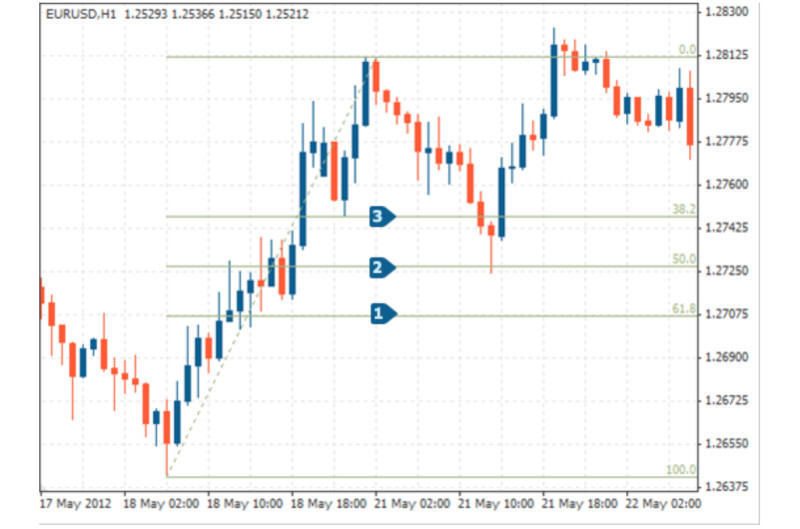
In a downtrend, levels are drawn from top to bottom, i.e. the top point is 100% and the bottom point is 0%. Conversely, in the case of an ascending trend, the lines are drawn from the bottom to the top, i.e. the lower point is 100% and the upper is 0%.
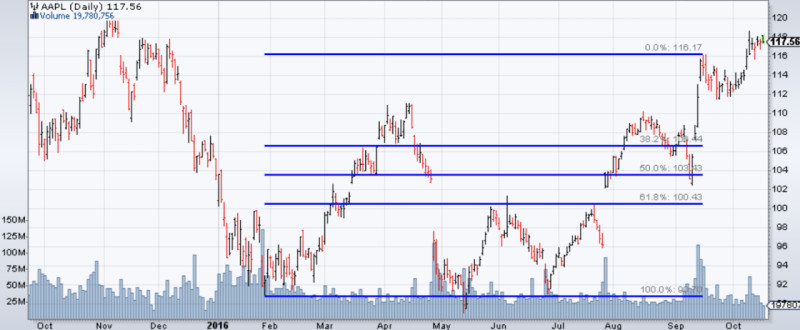
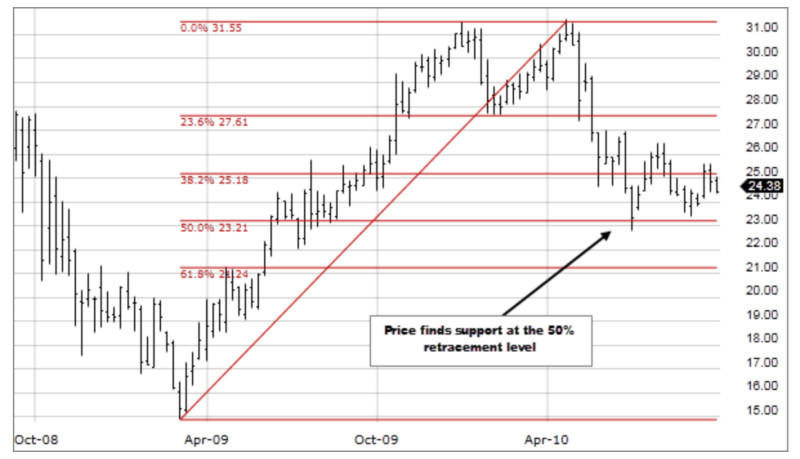
Retracement levels indicate how strong a correction can be. In addition to 0% and 100%, the main levels are 38.2%, 50%, and 61.8%. Using these levels, it is possible to determine entry points into the market.
There are two possible ways to enter a position: aggressive and conservative. When using the aggressive strategy, you can open a position every time the price reaches the next correction level.
A protective order is placed on the opposite side of the level. If it triggers, you open another position at the next level.
A more conservative approach requires waiting for the price to reach the support or resistance level formed by the Fibonacci lines, and then go back. One may enter the market when the price continues to move in the previous direction.
Fibonacci extensions
Extension levels can be used by traders as correction levels. However, their main task is to determine the future direction of price movement and fix profits.
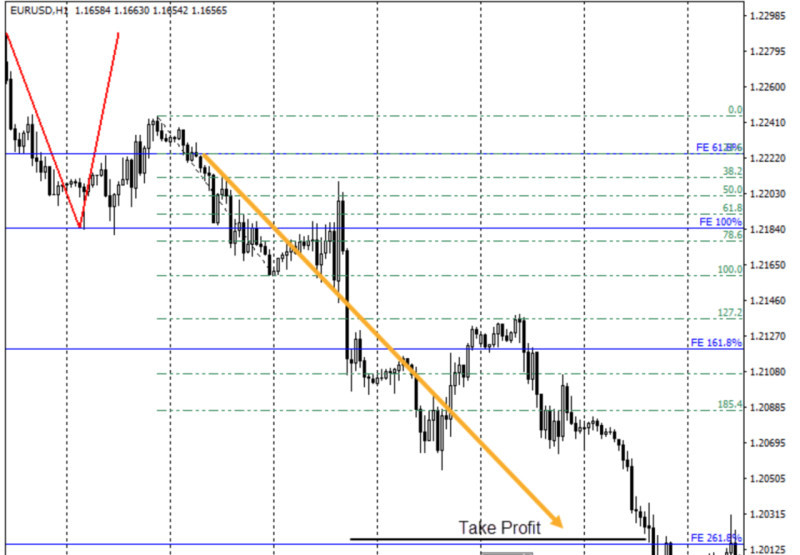
There are a large number of such levels, among the most commonly used are 161.8%, 261.8%, 423.6%, and some others.
There are two types of extensions:
- Additional levels, at which the price can make a reversal;
- The zones between the additional lines, inside of which the value can stop and then reverse.
This indicator works in conjunction with another analytical tool the Elliott Waves. Fibo extensions are used to determine the moment when the third wave ends.
That is why, unlike correction levels, extension levels are built not on one trend line, but on two. The second line often becomes a correction relative to the first one, and the point of its completion becomes the starting point for drawing Fibo extensions.
These two waves - trend and correctional - form projections. The beginning of the projection is the high or low on the chart, in which the reversal of the dominant trend takes place.
The most important projection levels include both correction and extension levels: 61.8%, 100%, 161.8%, and 261.8%. When the price breaks through the level of 61.8%, it becomes a very strong support or resistance level (depending on which direction the trend reversal occurred).
Fibonacci time zones
For the time zone indicator, the numbers from the Fibonacci sequence are used, not the percentages between them. Moreover, these lines are drawn vertically.
It is believed that at the points where the price crosses these lines, any significant changes may occur. Accordingly, these points may be a good time to enter the market.
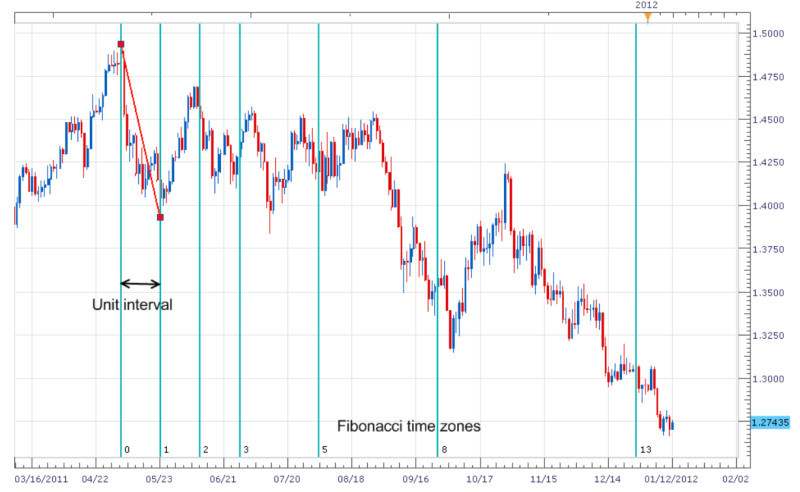
The most important point when using this tool is the correct choice of the start and end points of the first interval as the indicator will calculate and plot all subsequent intervals on the chart depending on this.
As the sequence of numbers continues, the distance between the vertical lines increases. Many traders use the "accumulation principle" to get more accurate signals.
Experienced traders skip the first 5-7 intervals because the distance between them is too insignificant to make significant changes in the market.
According to the classic approach, the potential reversal zones appear starting from zone 8, which includes 21 days on a daily chart or periods. Zone 9 includes 34 days/periods, zone 10 includes 55 periods, zone 11 includes 89 periods, etc.
For this purpose, several rows of Fibo intervals are plotted on the chart at once. Zones in which there is the greatest accumulation of vertical lines attract the most attention.
However, we should understand that the chart passing through each successive interval does not necessarily mean the reversal of the current trend. Passing through these lines can also mean the continuation of the dominant trend.
The Fibo time zones is a useful tool, but not self-sufficient. That is why it is so important to use additional, which can confirm or filter out the signal received from the time zones.
Fibonacci fan
There are times in the market when the value moves very strongly. The horizontal Fibonacci levels can give many false signals during periods of high volatility.
Therefore, in such situations, traders can use another tool, the Fibonacci fan. Since all lines are drawn from one point on the chart, the construction of the fan is slightly different for ascending and descending trends.
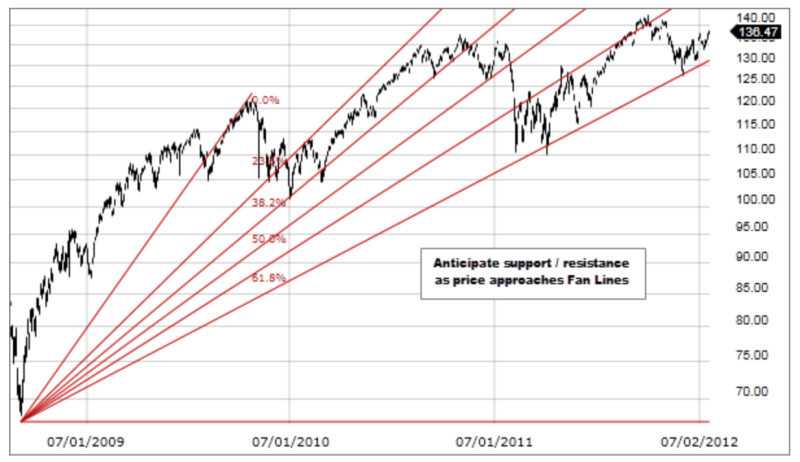
In downtrends, lines are drawn from the highest point to the lowest one. The first line connecting these points is considered the zero point, the subsequent levels are drawn above this line.
In uptrends, on the contrary, lines are drawn from the lowest point to the highest one on the chart. The first line is also considered to be zero, but the following levels - 38.2%, 50%, 61.8% - are plotted below this line.
The strongest level in this instrument is 50%. If the chart crosses the 38.2% level, it most likely indicates the beginning of the correction, after which the price may bounce from the next level and continue to move.
In addition to the standard lines, it is possible to draw a level of 76.4%. When the chart crosses this level, we can talk about a potential change in the current trend to the opposite.
Nevertheless, it should be remembered that this tool should not be used as a separate strategy. It is necessary to check and complement its signals by other means.
For example, you can additionally use the analysis by Japanese candlesticks. The formation of some candlestick types or their combinations can confirm the Fibo fan signal about the correction or the upcoming trend change.
Also, you should timely fix the moment when the fan stops working due to the distance from the initial construction points. In such a situation, a new trend line should be drawn and new fan levels should be plotted from it.
Fibonacci channel
Channel strategies are very popular among traders. Price channels, or corridors, can be constructed in a variety of ways and with a variety of tools. One such method is Fibo lines.
Unlike classical levels, in this tool, the lines are drawn parallel to the trend line. That is, they are applied not horizontally, but at an angle.
This tool is included in the standard set of most trading platforms. To use it, additional Fibonacci levels are applied to the standard equidistant channel.
The equidistant channel has only two lines, between which the price moves. In the case of the Fibo channel, additional levels make it possible to determine intermediate trend movements and correction periods by identifying potential key levels.
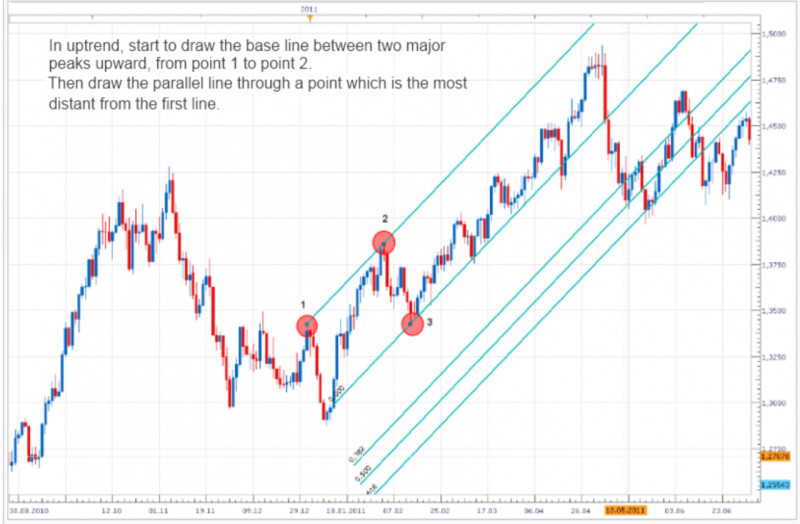
To build an equidistant channel you need three points - these are local extremes on the chart. When forming an uptrend, it is necessary to find the starting point which is the first low. The next point is high, testing the resistance level. The third point is the next low.
Then the price overcomes these levels and approaches the next boundaries. It should be understood that the price does not go through each successive level at once. Approaching each line, it may either consolidate or reverse.
That is how the price moves within a channel. It happens until it makes a breakthrough either in the current trend direction or in the opposite one.
Some traders prefer to use simple line charts for drawing Fibo channels instead of using bars or Japanese candlesticks. Then, when the channels are built, you can switch back to candlesticks and use their readings to enter the market.
Fibonacci arcs
Unlike all previous instruments, Fibo arcs are not drawn in the form of straight lines, but in the form of semicircles or semi-ellipses, i.e., arcs. This is their advantage because they simultaneously take into account two parameters: changes in value and time.
Why is this an advantage? Traders can assume how the value of an asset will change and in what period these changes will occur.
Only a few lines are plotted as standard: the first line is the trend line from low to high in the case of an uptrend and, conversely, from peak to trough in the case of a downtrend.
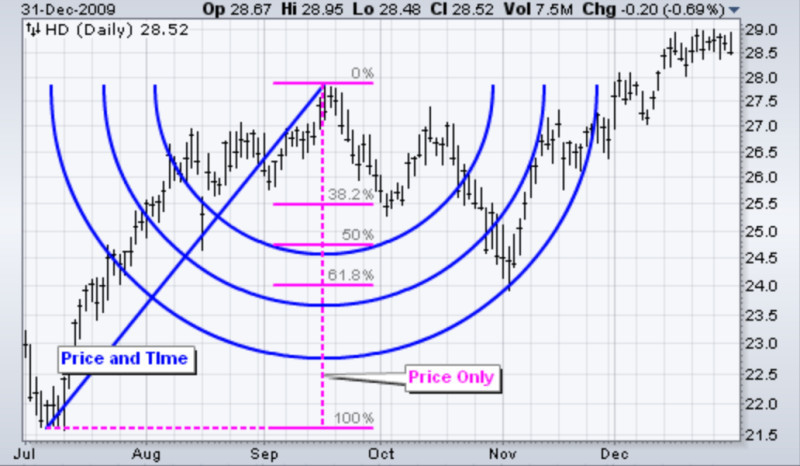
Next, three Fibo arcs with values of 38.2%, 50%, and 68.1% are plotted on the chart and cross the trend line. These arcs are considered potential support and resistance levels.
How do Fibonacci curves take time into account? If values have changed significantly over a long period, the arcs will be built with a larger radius.
On the contrary, if values fluctuate slightly over short time intervals, the arcs will have a smaller radius.
In general, Fibo arcs are used for trading similar to classical levels. Having reached a certain level, the price can either bounce from it, and make a short-term correction or reversal, or continue moving in the same direction.
Experienced traders think that this tool works especially effectively in short-term strategies, especially scalping. In addition, it is excellent for practicing your trading skills.
Fibonacci trading strategy
Although we paid a lot of attention to various technical indicators based on Fibo numbers and their ratios, the Fibonacci strategy based on retracement levels remains the most popular.
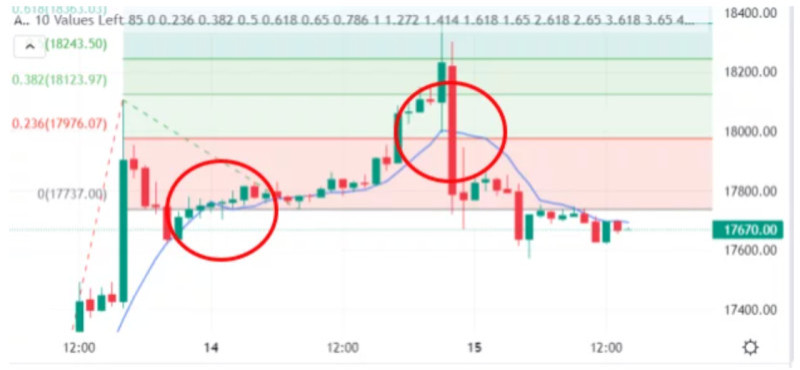
We have mentioned more than once that the price of an asset usually does not break through one level or another at once. Often, when the price reaches a certain level, it bounces from that level and goes back to the previous one.
Thus, for some time, the price moves between two lines, which become the support and resistance levels. This is the market consolidation or a correction.
After its completion, the price finally breaks through the upper or lower boundary. As a result of this breakout, the market may experience a change in the current trend, but it may also continue moving in the previous direction.
It is important to understand that just making the price chart pass through the Fibo levels is not enough to get reliable signals of the dominant trend continuation or its change.
To confirm these signals, it is necessary to use other tools in your strategy. Experienced traders supplement the Fibo levels with a candlestick or chart analysis.
The most important thing for a trader is the ability to distinguish a correction, i.e. a short-term trend change or a pullback in the opposite direction, from a full-fledged trend reversal.
It is considered that the key level is 61.8% - this is where the change of the current trend to the opposite often occurs. This situation is typical when the price breaks through this level.
However, it is desirable that in case the price breaks this level on the chart there is also a combination of candlesticks or a reversal pattern confirming the reversal.
Elliott waves
As we have already mentioned, the indicators developed based on the Fibo sequence are closely related to another method of technical analysis - the Elliott waves. Let us consider it in a little more detail in this section.
Thus, this method is based on the theory that everything in nature has a cyclic or wave nature. Fluctuations in price are caused not by the behavior of concrete people, but by their collective actions which is also called crowd behavior.
The classical theory of technical analysis is based on the statement that the market is cyclic. It is also assumed that movement and changes in price are not chaotic, but have a clear direction or trends.
Elliott in his theory has expanded this idea and added to it the idea that within each trend movement, there are wave cycles. That is, there are various periods when the intensity of fluctuations increases or, conversely, decreases.
It is these alternating periods, or sections, that Elliott called waves. Each wave is a directional movement of the value, regardless of its intensity. The author of the theory distinguishes between two main types of waves:
- Impulse waves;
- Corrective waves (diagonal waves).
The first type includes waves that determine the direction of value movement. The second type includes waves, the movement within which occurs in the direction opposite to the current trend.
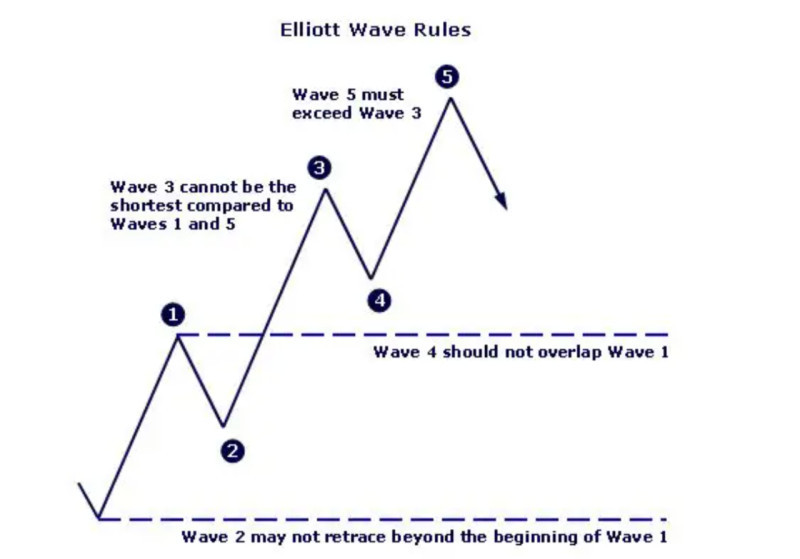
Elliott identifies five waves in each trend movement: three impulse waves and two correction waves. The first, third, and fifth waves are impulse waves and coincide in direction with the trend, and the second and fourth waves are corrective.
Fibonacci trading strategy and Elliott waves
How are Fibonacci levels and Elliott Wave Theory related? Thanks to Fibonacci levels, we can determine the length of waves, the depth of correction, and so on.
When the first impulse wave is formed, the Fibonacci lines can already be plotted on the chart. They are used to check the correctness of the formation of the following corrective wave. As a rule, a pullback should not occur below the level of 50-61.8%.
The third wave should be longer than the first one. It may reach the Fibo extension level of 161.8%. If it passes above that level, the price is likely to reverse near 261.8%.
After the third wave, a fourth, corrective wave is formed. As a rule, it is the shortest wave and is about 38.2% of the length of the previous third wave. Rarely, a pullback may reach 50%.
The fifth wave that completes the cycle is impulsive. Its length should be at least 61.8% of the length of the first wave. Sometimes, when the third segment reaches the extension level of 161.8%, the length of the fifth wave may reach 100% or even higher.
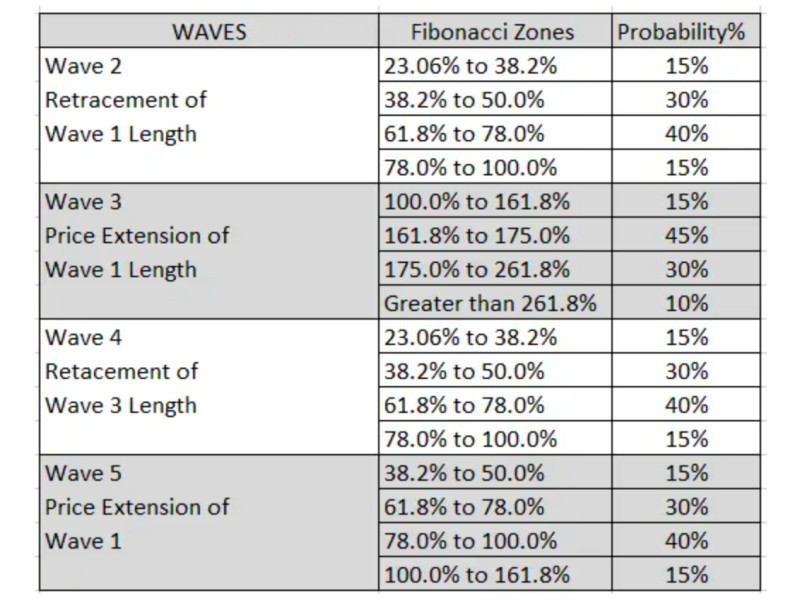
After the formation of the first wave, it is possible to determine the targets for the last, fifth wave. To do this, multiply the height of the first segment by 161.8% and mark this distance up from its endpoint.
After the formation of the third wave, it is possible to clarify or set another goal for the last segment. The closer the resulting targets for the fifth wave are, the more likely it is to see a trend reversal.
Pros and cons
The Fibonacci strategy has its upsides and downsides, just like any other analytical tool. In this section, we will look at them in more detail.
The advantages of this tool are the following:
- It is easy to use. The levels are already built into the trading platform and you can place them on the chart with a single click. All the user has to do is to find the beginning and the end of the trend movement on the chart, and then the program will draw the levels between these points;
- Accuracy in determining the moments of correction. Fibo levels allow traders to identify the moments of a short-term reversal (correction) or a complete change in the market trend;
- Universality. This tool can be used in any market and for the analysis of any type of asset. Also, any time frame is suitable for its use, but there is a rule: the higher the time frame - the more accurate the signals;
- It can be successfully used as an additional tool. It is quite risky to make decisions about opening trades based only on the signals of Fibonacci levels. However, using it in combination with other methods of analysis can be very useful;
- It considers the psychological factor. The levels are not only based on a mathematical formula but also reflect the sentiment of the majority of traders.
Among the disadvantages of this trading algorithm, traders note:
- Rather difficult to determine the point of the beginning of the dominant trend. In this regard, the accuracy and correctness of drawing levels on the chart are questionable;
- The price may reverse before reaching a level. This may be related to the previous point, since if the grid is drawn incorrectly, the signals may be incorrect as well;
- It cannot be used in automated strategies. It is impossible to create a trading robot or an Expert Advisor based on this tool, so Fibo levels are suitable for manual trading only;
- Not suitable for lower time frames. This is because the tool can give a lot of false signals on lower time frames, such as M1 or M5 because there is a lot of market noise;
- The tool takes into account only past values of the asset value in the calculations. It does not include factors such as financial statements of companies, market reactions to press releases, and important economic news. However, this drawback can be leveled out by combining technical analysis with fundamental analysis.
Fibonacci strategy
Since tools based on the Fibo sequence, in most cases, are not self-sufficient, the Fibonacci strategy should include other elements as well.
The combined use of Fibo levels and the Price Action strategy is quite effective. In other words, it is necessary to look for confirmation of the end of a correction period or a potential reversal on the chart itself.
Initially, it is necessary to identify the start and end points of the dominant trend. Then you can overlay a grid of Fibo levels on the chart and begin to analyze the potential further movement of the value.
For example, if there is a downtrend, it is necessary to draw a trend line downwards. At the lowest point, a new emerging trend can be observed.
As the price begins to move upwards and break through the Fibonacci levels, it is possible to assume that the current downtrend is changing.
However, you should not open a long position as long as there is no confirmation of the continuation of this trend. Depending on which candlestick is formed, the Fibo level below which it appears will be either support or resistance.
In the former case, the price overcomes the level and continues to move upward, while in the latter, on the contrary, it rebounds from the level and continues to move in the previous direction.
The formation of reversal candlesticks or their combinations serves as a good signal of the end of a correction period in the market. In cases where these combinations are formed near key Fibo lines, their signals complement and reinforce each other.
How to draw levels correctly
For the Fibonacci levels to work, they must be constructed correctly. Otherwise, you may encounter situations where the price reverses without reaching a line.
Novice traders immediately suspect that the tool does not work. The problem is often that it is not being used properly.
Levels should be plotted correctly on the chart to work efficiently. It seems that this is not difficult since this tool is included in the standard set of indicators of most modern trading platforms.
The lines are superimposed on the chart automatically between the beginning and the end of the trend movement. However, the trend line itself is drawn by the user, stretching it from the upper to the lower point (in case of a downtrend) or vice versa.
One of the most important things when using Fibo levels is to determine the points where the directional movement of the price begins and ends.
The lines are displayed as a percentage of the total movement made by the price. Accordingly, the level of 38.2% is set at a point equal to 38.2% of the total distance that the value covered during the given time.
Each of the Fibonacci lines may act as support or resistance depending on the dominant trend and price movements near those levels.
In downtrends, when the price rebounds from a level and keeps going in the same direction it becomes a resistance level, and if the line is broken it becomes a support level.
In uptrends, on the contrary, when the price keeps moving in the same direction, the level becomes support, and if the price breaks through the level and changes direction, the line becomes a resistance.
Another mistake traders make is relying only on Fibo levels and not checking their signals with additional instruments. The signal can always be checked using candlesticks or other technical indicators.
How to open trades
We have already mentioned that each Fibo correction level can be used for potential entry into a position. So, how to correctly determine the level to open the trade? Let's find out.
To begin with, it is necessary to correctly plot the levels on the chart. In this case, we can count on the fact that the levels will work correctly.
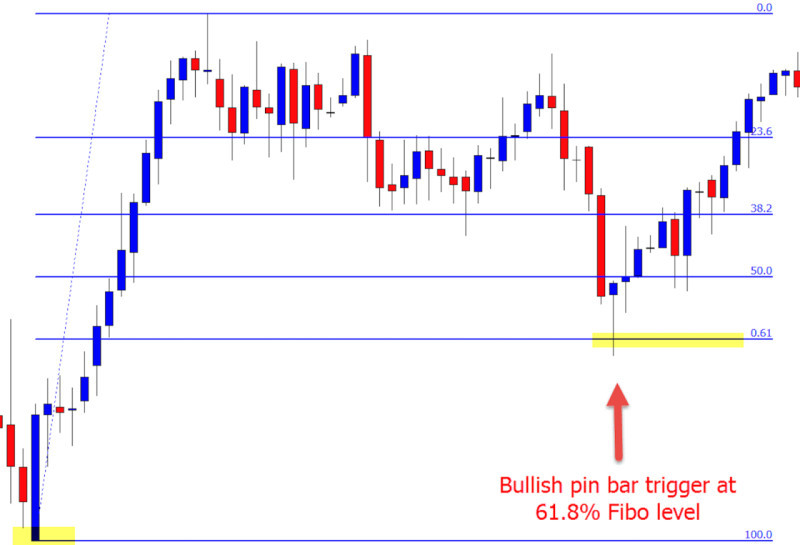
The most popular is considered to be the area between the 50% and 61.8% lines during the rising trend. The confirmation of the continuation of the dominant uptrend is the formation of a bullish candlestick, which closes above the previous one, near the level of 61.8%.
Thus, a trader receives a confirmed signal to buy the asset. To receive a sell signal, the following conditions should be met.
In downtrends, after the correction between the 50% and 61.8% levels is completed, the formation of a bearish candlestick, which closes below the previous one, confirms the continuation of the trend.
In the same way, potential reversal points of the current trend can be found. This happens when a reversal candlestick or chart pattern is formed when the key Fibo level is reached.
That is, if the trend was downward, but a reversal pattern is formed, we can expect the trend to change to an opposite one and open long positions. On the contrary, when the reversal pattern is expected to turn downward and you can open a short position.
As an insurance measure, you may place protective Stop-Loss and Take-Profit orders. The level of Stop-Loss is set at a level below the level at which you enter the position.
For example, if you open a trade at 38.2%, the Stop Loss is set just below the line of 50%, and if the entry into the position will be carried out at the level of 50%, then the SL order is placed beyond the next level of 61.8%.
The second way to set an SL order is to place it at a level just above or below (depending on the direction of the current trend) the high or low of the trend movement, based on which the Fibo level is built.
Fibonacci levels and other technical indicators
We have already mentioned that the Fibonacci strategy should include other indicators and methods of market analysis. This is because Fibo tools themselves are not self-sufficient.
For example, you can add a moving average to the chart. Points of intersection of Fibo levels and moving averages confirm the presence and strength of the level at which this crossing occurs.
In addition, Fibonacci levels can be used with oscillators. Often, indicators such as Stochastic or RSI are used. With the help of these tools, you can determine the overbought and oversold areas on the chart.
When the signals of these indicators appear near Fibo levels, it also confirms the strength of these levels. As we already know, the strongest level among the Fibonacci lines is 61.8%.
Accordingly, when the price reaches this level during an uptrend, it is necessary to wait for the oscillator signal on the end of the oversold zone, i.e. the crossing of 80. If the signal is received, it is possible to open a buy position.
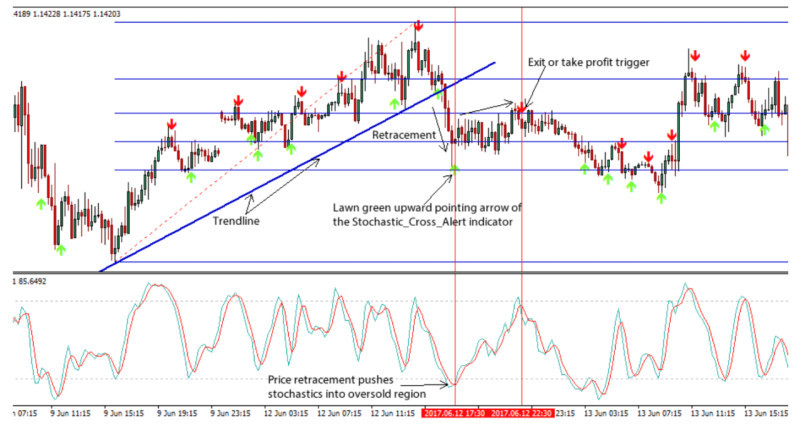
When we observe the same pattern in a downtrend and the oscillator gives a signal of the end of the overbought zone, that is, crossing the level of 20, we can open a short position.
As we have already mentioned, Stop Loss orders are usually placed near the next Fibonacci level below or above 76.4%.
A Take Profit order is set using the Fibonacci extension levels. To determine it, we add 100 to the specified level, thus obtaining a level of 161.8%.
The only disadvantage of this combination of indicators is that the signals will not come every day. Nevertheless, they are considered very reliable if all conditions are met.
Basic rules
We have considered many different options for using both the sequence of Fibonacci numbers and their ratios. However, you should understand that the Fibonacci strategy requires following some rules. We have collected the main ones in this section:
- No experienced trader will build their trading strategy based on Fibonacci instruments alone. Always use additional strategies to analyze the market and confirm signals from the Fibonacci level.
- Traders often use Price Action as additional tools, i.e. the price movement itself, the formation of certain types of Japanese candlesticks or their combinations, as well as patterns.
- When arcs and Fibo fans are plotted simultaneously on a chart, support, and resistance levels can easily be determined by the points of intersection of these lines.
- Use higher time frames to avoid market noise and get fewer false signals. Optimal for the use of Fibo levels are time frames higher than H1. It is better to use H4 or D1.
- Since this tool works most effectively at higher time frames, it is best used in medium- and long-term strategies.
- Regardless of the direction of the current trend, the Fibo tool is always plotted from left to right on the chart. Only in an uptrend, it is from bottom to top, and in a downtrend it is from top to bottom.
- Depending on your risk exposure, you can use a more aggressive strategy where trades are opened when the chart reaches each level. A more conservative approach would be to wait for the correction to end and enter the market in the current trend.
- Nevertheless, regardless of how much you are willing to risk, it is not recommended to use 2% or more for a single position, but no more than 5% of the entire deposit amount.
- This tool can be used for trading in any market, including stock markets and Forex.
- Do not forget about protective orders. Stop Loss orders can be placed or below the level following the level where you opened a position. It is also possible to place it at the level of the swing low or high of the trend line.
Conclusion
In this article, we looked at how a Fibonacci trading strategy can be constructed using special levels superimposed on the chart.
Fibonacci levels are constructed based on a unique sequence of numbers and ratios between them. The main one among these ratios is called the Golden Ratio and is found in nature as well as in trading.
This value is 0.681 or 68.1% and it is one of the key levels among all Fibo lines. It is at this level that the reversal of the current trend often takes place.
However, for levels to work out correctly, they need to be properly plotted. To do this, you need to correctly identify the start and end points of the dominant trend and connect them with a line. This line is always drawn from left to right.
Also, it is better to use this tool on higher time frames to avoid market noise and get more reliable signals.
In addition, you can use additional tools to confirm Fibo signals. It is possible to apply candlesticks and their combinations, as well as graphic patterns. All this is on the chart.
Moving averages or oscillators are also used as additional indicators. They confirm the presence and strength of levels and give signals to enter a position at a particular level.
In addition to levels, other indicators have been developed based on ratios between Fibo numbers: extensions, fans, channels, and some others. Each of them has its peculiarities of construction and use.
You may also like:
Support and resistance trading strategy


