Traders, especially beginners, are frequently baffled about developing their own trading strategy. They have to spend a lot of time and effort and also gain enough experience.
However, at the same time, you want to dive into trading and make a profit right now. In such situations, ready-made trading strategies, previously created by other more experienced traders, come to the aid of market participants.
If it is your case, you can learn about trading algorithms, their features, and the principles of choosing the right one for an individual trader, from the article "Forex Strategies".
What is Larry Williams

Larry Williams is a renowned and very experienced trader from the US. The trading strategy of Larry Williams is popular among speculators around the world due to its simplicity and efficiency. We will analyze it in more detail in this article.
Williams is not only the developer of a trading algorithm, but also the creator of several technical indicators and the author of several books on trading.
The speculator initially tried his hand at stock trading, but on the advice of friends, he shifted focus to the futures market and started trading futures contracts. This is how he made his first million back in the 1970s.
Larry Williams gained international recognition after he managed to win the world championship in futures trading in 1987. With a starting capital of $10,000, he managed to earn $1,100,000 in one year. This record has not been broken yet.
After such success, many investors became interested in how Williams managed to get such a huge profit. So, Larry began to write books and teach beginners.
Among his most famous books, "Long-term secrets of short-term trading" deserves special attention. Here, he expands on the trading strategy he developed, as well as all the specifics of choosing assets for trading and finding entry points to a position.
His other books are devoted to his victory in the trading championship, the selection of stocks for an investment portfolio, the influence of insiders on the market, a guide to trading futures, and other topics.
Williams also developed several his own indicators. The most famous of these is the Williams’R or Williams’ percentage range. The essence of this indicator is a trader’s priority is to determine the current situation and who dominates the market: sellers or buyers, rather than to predict a further price trajectory.
Larry Williams’ strategy
The trading algorithm developed by Larry Williams is not based on any complex indicators or settings. Only two additional lines are applied to the chart, moving averages (MA).
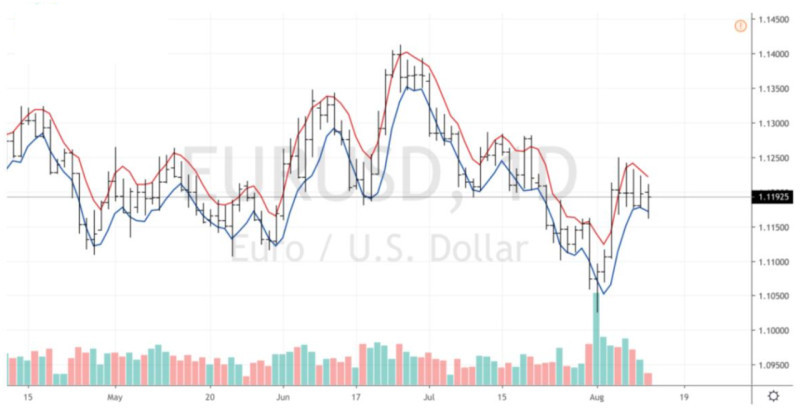
Both moving averages have the same period - 3. At the same time, one of them is built on the lows, and the second on the highs of candles or bars. It is recommended to highlight the lines with contrasting colors so that they differ from each other.
As for the timeframes, the author of the method recommends using fairly short timeframes: M5 or M15. Notably, trading on M15 will be more laid-back.
The important point is to determine the current trend and trade only following the trend. Thus, if the trend goes up, then the trader should only open buy positions. Conversely, in a downtrend, the trader opens sell positions.
Accordingly, in the course of the uptrend, a buy position is opened when the lower moving average, built on price lows, is touched. Positions are closed when the price touches the upper MA.
Opening a sell position is carried out following the opposite principle. That is, a sell trade is opened when the price touches the upper line built on the highs. The trade is closed when the lower MA is reached.
In this case, the important point is exactly the intersection of the moving average with the price. If the candles create the current trend but do not cross the MA, then trades are not opened in this case. That is, there should be a "breakdown" of the channel formed between the two MAs.
Range areas in Larry Williams’ strategy
Each speculator wants to understand how the cycles of price moves are arranged. Larry Williams spent more than 15 years studying this issue, but he never found a time cycle.
However, he was able to find other cycles, one of which is called the "natural cycle of changing ranges." The author presents the price movement in the form of a "pace of a drunken sailor".
The "sailor" moves from point A to point B, but he can stroll following varied and sometimes unpredictable trajectories. He moves with small pauses, then returns a little back or crouches, and then he begins to actively move around running. At the same time, we know for sure that he will reach point B anyway.
Despite Williams' assertion that in each period of time the price changes freely, it still obeys some regular patterns.
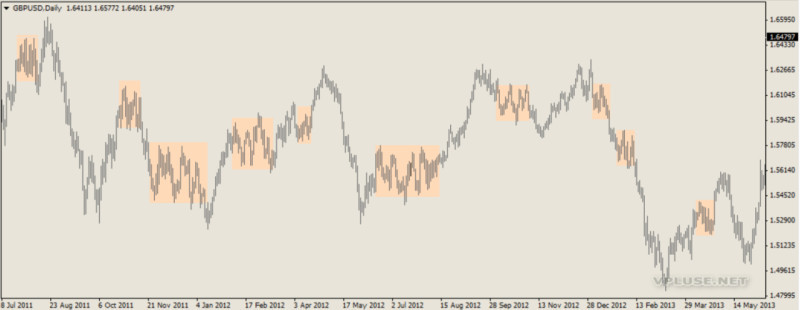
Thus, the movement in the ranges occurs from small clusters to large ones. This also works in the opposite direction, that is, after a series of large ranges, small ones begin. This is exactly what the cyclical nature of the market is – the alternation of large and small ranges.
Small range zones are nothing more than periods of correction or market consolidation after periods of large directional movements. The stable repetition of these cycles leaves the secret of breakeven trading according to Larry Williams.
According to the author, it is necessary to choose volatile markets, where there are a large number of small ranges, which are subsequently replaced by large ranges.
It is necessary to be able to determine the expansion and narrowing of the ranges on the chart and correctly respond to these changes.
Recognition of market entry points
How to find entry points to a position? These points are not always easy to find, but Larry Williams' strategy clears up the point.
To determine entry points, it is recommended to use candle combinations or combinations of bars. There are several such combinations in this trading algorithm.
Combinations of three candles or bars. Combinations are formed on the chart in which the middle candlestick is either the maximum between two neighboring candles or the minimum. Such combinations indicate the emergence of a new trend in the market.
At the same time, in a combination where the average candle is a minimum, it is a signal to open a buy deal. The entry point to the position is the top of this candle.
Accordingly, in a combination where the central candlestick is a top, it becomes a sell signal. The trade entry point is the low of this candle.
Combinations of two candles or bars. There are two main varieties of such combinations: Inner Day and Outer Day. They differ in appearance and signals that are given to the trader.
The Inner Day is a combination of two bars, the first of which is considerably larger than the next. Thus, it seems that the second bar is placed inside the first one.
This combination does not indicate a reversal of the current trend but rather confirms its continuation. On lower time frames, such periods may look like small consolidations, after which the dominant trend continues.
The Outside Day differs from the previous combination in that here the second candle absorbs the previous one, that is, it significantly exceeds the first in size.
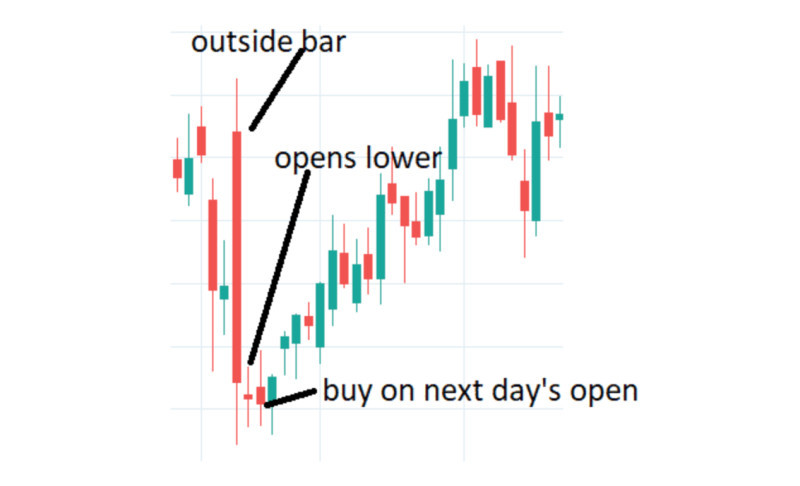
It all depends on how the second candle closes. Either a reversal of the current trend may occur, or a short-term correction with the subsequent movement of the value in the same direction.
Smash day
There is another pattern in the strategy of Larry Williams, which is formed by just one candle or bar and is called Smash Day. Such a bar is formed when the value of an asset makes a powerful swing in one direction or another.
This sharp price movement encourages traders to open positions en masse in the same direction. However, subsequently, the price reverses and the traders have to close their positions at a loss.
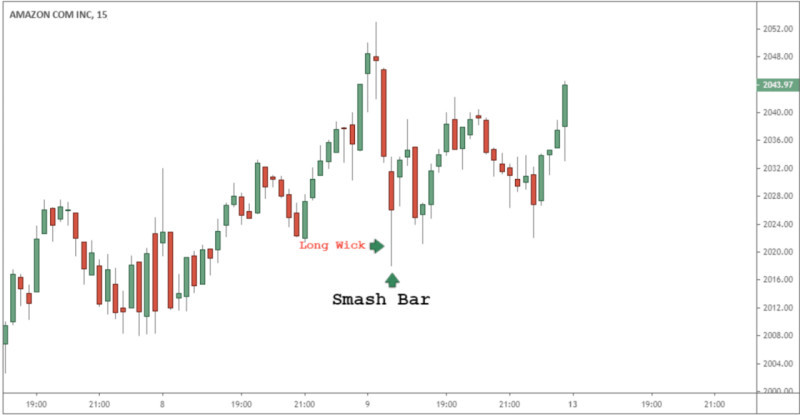
Depending on the direction in which the price makes a breakthrough, there is a Smash Day for buying and a Smash Day for selling.
In the first case, there is a downtrend in the market, during which the signal candle closes below the low of the previous session. It may even be below the lows of the previous few days.
If, after the formation of such a candle, the candle following it starts moving in the opposite direction and closes above the high of the signal candle, you can open a buy trade.
In addition, such a candle may mean the end of the correction period. In this case, you can open positions on the previous trend.
The Smash Day for short positions is formed during an uptrend. The signal candle is formed at the maximum level and is above the previous peaks.
After the formation of such a candle, the current trend changes to a downtrend and the trader can open positions to sell. If this candle is formed during the correction, then it marks the end of the correction period and the continuation of the previous trend.
Besides, such a candlestick can be created during a sideways movement of an asset, that is when the market is flat. In such a situation, it is necessary to assess in which direction the movement occurs after the appearance of a signal candle and open positions in this direction.
Hidden Smash Day
There is another kind of pattern developed by Larry Williams. By analogy with the previous model, it is also called Smash Day, but it is hidden. Let’s consider in more detail what it means.
However, unlike the previous pattern, the formation of a Hidden Smash Day indicates a continuation of the current trend, but not its reversal. On the chart, such a candle has a small body, but a very long shadow, which is directed towards the prevailing trend in the market.
The price encounters strong resistance as the price chart moves, but there is no reversal. In such a situation, a high or low is updated (depending on the overall trend) and the current trend continues.
There are two variations of this model: Hidden Smash Day for buying and for selling. In the first case, a high volatility candle is formed on the chart, the maximum of which is higher than the previous one, and it closes in the lower part of the range.
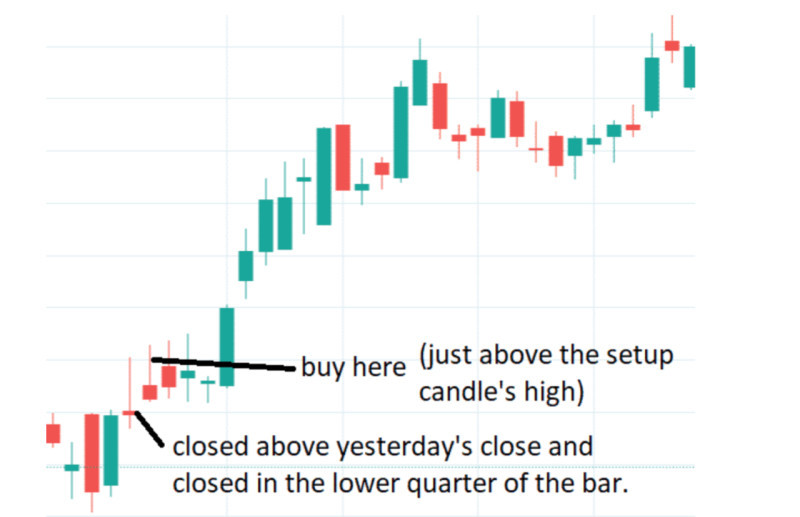
An important condition in this case is that the closing price must be within the lower 25% of the entire intraday movement. When the next candle is formed, which closes above the Hidden Smash Day’s high, you can open a buy position.
The Hidden Smash Day’s sell pattern is formed during the prevailing downtrend in the market. A candle is formed when its minimum is below the previous candle.
In this case, the closing price should fall into the upper 25% of the intraday range. The candle following this candle should update the low of the signal candle. This means a further downtrend, hence, you can open a sell position.
Trap of specialists
The Larry Williams strategy uses another concept in trading, the Trap of Specialists or Trap of Professionals. The essence of this method is a false breakout that occurs during a small correction in the market.
In a nutshell, the trap is activated at the moment the price goes beyond the range. This assures traders to open positions in order to earn on further price movements. At the same moment, they close their positions and begin trading in the opposite direction.
There are two types of traps: a sell trap and a buy trap. In the first case, there is an upward trend followed by a small period of consolidation. Then, the price makes a sharp upward jump.
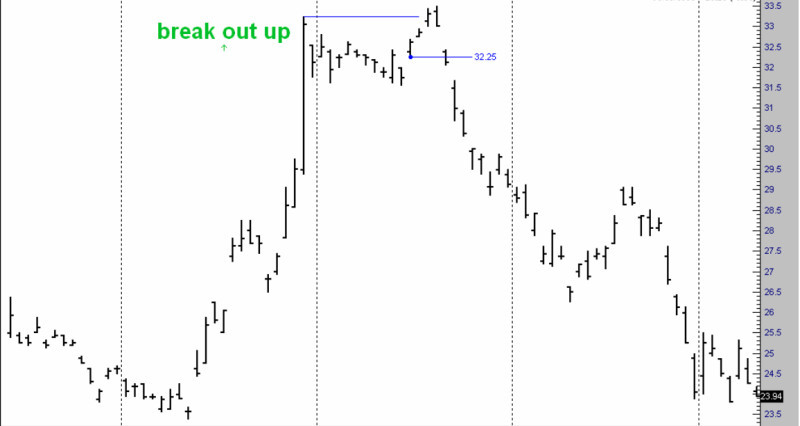
If, after such a breakout, the price goes down and falls below the low of the signal candle for several days, this opens up the opportunity to go short.
A buy trap is formed during a downtrend, first the price moves within a small corridor, and then makes a sharp jump in a downward direction.
If, after such a jerk, the price closes higher in the next few days close it surpasses the high of the signal candle, this suggests the opportunity to go long.
In both cases, after a sharp and strong movement of the price in the current direction, the trend reverses. Therefore, traders need to be careful not to perceive such signals as evidence of a trend continuation.
Also, in both cases, a separate type of Japanese candlestick, Maribozu, acts as a signal candle. Such candles have long bodies but very short shadows or they might lack a shadow at all.
At the same time, a light or green Maribozu indicates an uptrend. A dark or red one indicates a downtrend.
Comparison with other channel strategies
In the previous section, we mentioned that Larry Williams' strategy is very similar to channel trading strategies. What are their similarities and differences? Let's go into more detail in this section.
One of the most important similarities is that the price seems to move within a certain corridor, which is limited by straight or smooth lines.
Price channels can line up with more than just support and resistance levels, which are clear straight lines parallel to each other.
There are other options for building channels. Moving averages are used for this in other methods, except for Williams’ strategy. For example, Bollinger Bands are also built according to the same principle, only different values for MA are set.
At the same time, we have already mentioned that one of the important principles of trading according to Larry Williams’ algorithm is the intersection of one of the moving averages by a candlestick depending on the direction of the current trend.
For other channel strategies, on the contrary, the rule is applied that trading is carried out only within the price range. All trades are opened and closed when the price moves between the upper and lower borders.
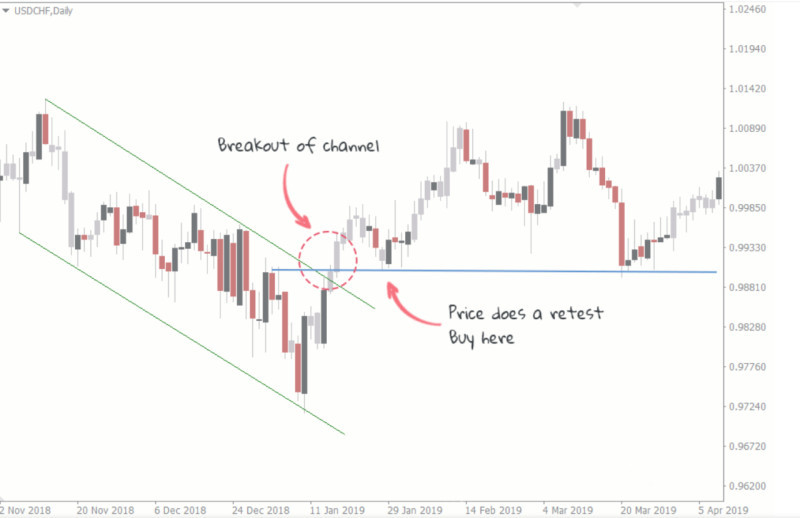
The exception is a breakthrough strategy, which involves entering a position when the price crosses one of the lines. However, after a breakout in one direction or another, the price no longer returns to the previous channel.
It starts a robust movement in the direction of the previous trend or creates a new trend. If the price crosses the borders of the range for a short time and returns to it, such a breakout in channel strategies is called false and is not used for trading.
Pros and Cons
Like any trading system, Larry Williams' strategy has both its positive and negative sides. Let's discuss them in this section.
The advantages of this trading algorithm include:
- Ease of use. This system can be used even by novice traders since it does not involve any complicated technical indicators or techniques;
• The chart is not overloaded. Only two moving averages are applied to the chart, which are used to receive signals;
• A time-tested strategy. This trading algorithm has been tested by thousands of speculators for quite a long time, and it has proven itself as a reliable way to get a stable income;
•Relevance. Despite the fact that the strategy was developed in the last century, it has not lost its relevance so far and has been successfully used by many traders;
• Versatility. The trading algorithm is suitable for any market and any asset, although it was originally created for futures trading.
Main disadvantages:
• A large number of false signals. This is due to various factors: rather small timeframes that are used for trading, high market volatility, and the period of the moving averages themselves;
• Low profit from each individual transaction. Since transactions are kept for short periods of time, the profit for each of them will be several pips. This disadvantage can be offset by trading on larger timeframes up to H1;
- Loss of profit on spreads. In fact, if you get a low profit from each transaction, you can completely lose it due to high commissions. To solve this problem, the author of the methodology suggests choosing assets with low spreads;
• Constant monitoring. Since this trading algorithm belongs to the category of short-term strategies, the trader needs to constantly be at the computer monitor and keep track of the market situation.
Rule of use
To achieve success in trading, you must follow the most important principles and rules of trading. Larry Williams' strategy also has some rules that traders need to follow:
1. Trade only in the current direction of movement of the asset's price. According to this strategy, positions are not opened against the trend.
2. Choose assets to trade with a small spread. Otherwise, high commission rates can "eat" all your profits from executed transactions. Since transactions in this type of trading are kept for a short term, you can’t count on high profits, but you can save them.
3. Follow the rules of risk and money management. Do not invest in trading more than 30% of all your savings (for beginners - no more than 20%) and allocate more than 5% of the total deposit per trade.
4. Choose volatile assets as this strategy works most effectively during a market buzz. For example, currency pairs need to be traded during those hours when this market is especially busy.
5. It is necessary to stay abreast of important economic and financial news. It is not recommended to trade during their publication, as well as within 15 minutes after. It is advisable to close all open positions 5 minutes before the news release.
6. On Forex, choose to trade currency pairs with a wide price range, such as USD/JPY, GBP/JPY, and so on.
7. Although the author of the strategy himself did not mention this, his followers recommend not to forget about setting protective orders. Stop Loss will save you from unexpected losses, and Take Profit will allow you to fix the already received profit.
8. Instead of applying for protective orders, you can simply close previously opened positions at the moment when the current trend reverses.
9. Use timeframes from M5 to H1. According to the author, his strategy works best for short time periods.
10. Pay attention to candle patterns, especially those that may indicate a potential reversal of the current trend. It is thanks to the occurrence of certain candlestick patterns or the appearance of certain types of single candles that a trader can recognize entry points to a position.
Conclusion
In this article, we have considered one of the simplest and most versatile trading algorithms, Larry Williams’ strategy. This system can be applied to any market to trade any asset.
The strategy uses only two indicators: two 3-period moving averages, one of which is based on price highs, and the other - on price lows. Thus, a kind of price channel is plotted, within which the price moves.
This strategy should be exploited only in the direction of the current trend. Accordingly, buy positions are opened during an uptrend when the chart crosses the lower MA, and sell positions are opened when the upper MA crosses and a downtrend is unfolding.
To accurately determine the current trend and market entry points, the strategy implies the use of combinations of candles or bars. These can be patterns consisting of three or two candles. In some situations, even a single candle of a certain type produces a signal.
You may also like:
Support and resistance trading strategy


 Back to articles


