


Most of the time, an asset price moves within certain ranges. As a rule, these ranges are bordered by two parallel lines, forming a price channel.
The channel forex strategy is aimed at getting profits both within a price channel and outside it when a price breaks one of the borders. In this review, we describe this strategy in more detail.
If you want to learn about other trading strategies, their advantages and drawbacks, as well as rules of their use, then you need to read an article about Forex strategies.
What is a price channel?
Channels are usually formed in the periods of weak price fluctuations. The price moves up and down in sequence. Such movements are prolonged.
Two parallel lines can be plotted based on the highs and lows formed during such movements. The lines, in turn, form a channel. The price fluctuates in this channel, bouncing from its borders.
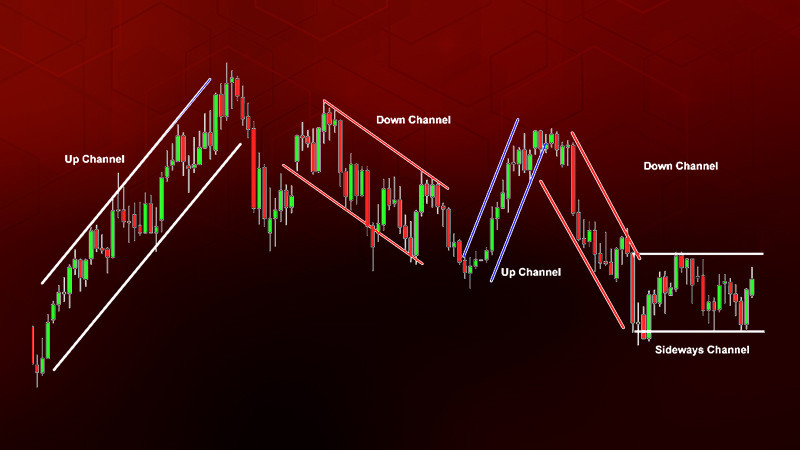
There are three types of price channels:
- upward (bullish)
- downward (bearish)
- sideways.
Three points are used to plot a price channel: two lows and one high in the case of an upward trend, and two highs and one low in the opposite case.
When a bullish price channel forms on a chart, we see progressively higher peaks followed by increasingly higher lows. Conversely, a bearish channel is marked by the appearance of lower lows and, subsequently, lower highs.
In a sideways price movement, the market is in a consolidation phase. Sellers and buyers take a breather before initiating or resuming active trading.
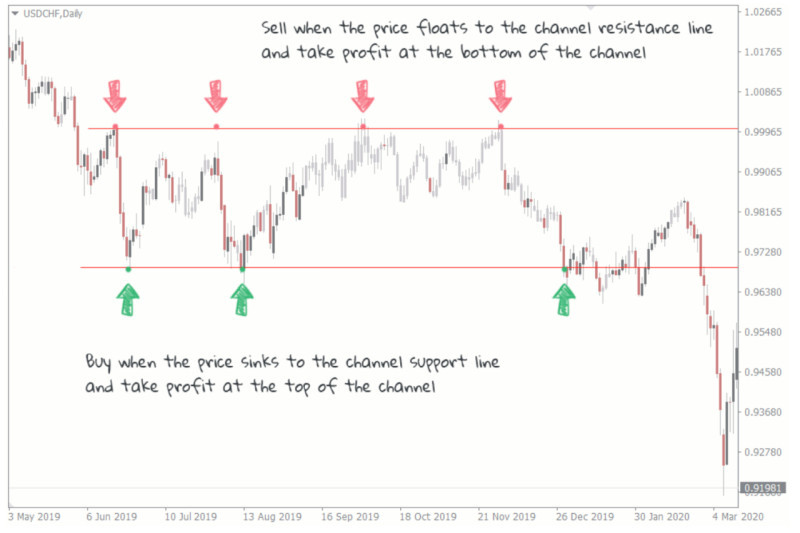
As long as the asset price moves within the channel, a trader can execute multiple short-term trades following the current trend direction. This means that when the price bounces off the lower boundary, buy orders can be placed, and when it touches the upper boundary, sell orders are placed.
However, it's essential to remember that the price cannot continuously move within these boundaries. Sooner or later, it will break the channel either upwards or downwards.
At this moment, traders can open a longer and more profitable position. But we will delve deeper into this topic a bit later.
How to plot a price channel
In channel Forex strategy, it's crucial to accurately plot price channels on charts. It involves determining the trend direction and drawing a trendline, which typically connects either lower lows or higher highs.
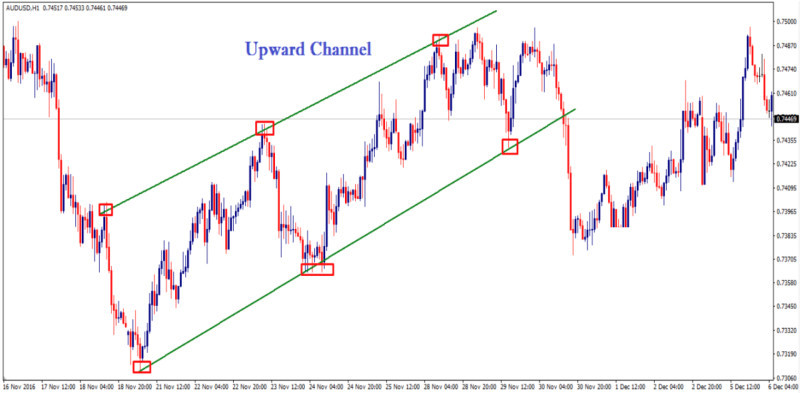
In case of an upward price channel, the first line is drawn by connecting two consecutive lows on the chart. It is a support line.
Next, a parallel resistance line is drawn by connecting two consecutive highs. This creates a channel within which the price moves.
Conversely, for a downward price channel, start by drawing the resistance line through two consecutive highs, followed by a parallel support line through two consecutive lows.
The points used to plot price channels are known as pivot points.
During market consolidation, the chart moves within a horizontal channel, which is often narrow, and price fluctuations inside it are relatively weak.
When plotting a sideways channel, the support and resistance levels are positioned horizontally, without any upward or downward slope, unlike bullish or bearish channels.
Price channels can be either confirmed or unconfirmed. Confirmed channels are those where the price touches the boundaries at least twice, while unconfirmed channels are those where the price touches the boundaries fewer than two times.
In general, the more often a price chart touches the boundaries, the more reliable the channel is considered. That's why it's essential to set up the price channel boundaries appropriately.
If the boundaries are plotted too far apart, the price line won't reach them. On the other hand, if they're plotted too close together, the chart will constantly breach one boundary or the other, resulting in false breakouts.
What other use cases of price channels?
Each channel boundary serves different purposes. Besides, one should pay attention to whether the channel is bearish or bullish.
In a bullish channel, buy trades are opened from the lower line, while short positions are placed from the upper line. The signals generated when the price touches the lower line are considered the most reliable, and trades are seen as the most profitable.
However, trades can also be opened against the current trend. For this, one should use signals generated when the price touches the upper boundary of the channel.
In a bearish market, the situation is the opposite: if a trader wants to open a trade in line with the current trend, i.e. to sell, they use signals from the upper line. If they want to go against the trend, they open long positions when the price touches the lower line.
Traders can also get important signals when the price chart crosses one of the channel boundaries. But the most significant thing here is not only which of the channel boundaries the chart crosses and in which direction, but also what kind of channel it is.
If the channel is ascending and the price breaks through the upper boundary from bottom to top, then the upward trend is likely to accelerate.
If the channel is ascending and the price line crosses the lower boundary from top to bottom, it indicates a potential reversal of the current upward trend.
In a bearish channel, the situation is the opposite. When the price line crosses the upper boundary from bottom to top, it suggests an impending change in trend towards increase.
If the chart in a descending channel breaks through the lower boundary from top to bottom, it indicates an intensification of the downward trend. As a rule, the trend strength equals the width of the channel.
Forex Channel strategy
How to use price channels in trading? The channel Forex strategy involves two main tactics: trading within the channel and trading on the breakout. Let's delve deeper into these options.
Trading in a channel requires one key element: the correct construction of the channel itself. If the boundaries of the channel are correctly defined, the price moves within these boundaries, touching either the upper or the lower boundary at different times.
As already mentioned that when trading within a channel, a trader has the opportunity to open a significant number of trades in both directions.
Regardless of whether the channel is ascending or descending, long positions are opened when the price bounces off the lower boundary, while short positions are opened when the price bounces off the upper boundary.
The only difference is that in a bullish channel, buy trades are opened along the trend while sell trades should be placed counter trend. In a bearish channel, the strategy is the opposite: short trades are placed in the trend direction and long ones are the counter trend.
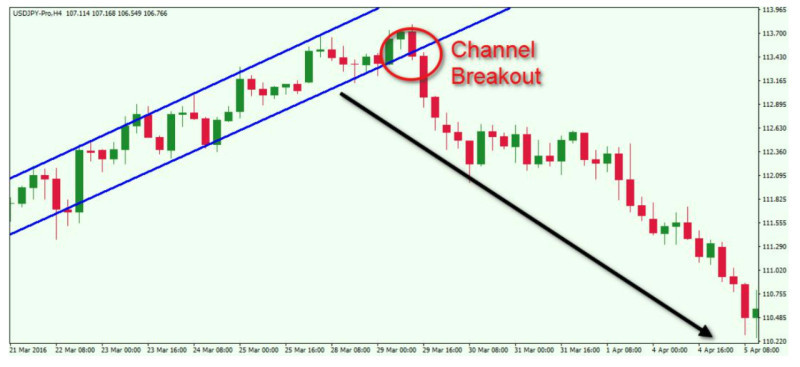
The second option refers to trading upon a break out of the channel. In this case, trades of a larger volume can be opened because the profit potential is higher compared to trading inside a channel. As already mentioned, a price can breach a channel boundary in any direction.
If the channel is ascending and the price breaks through a resistance level, i.e. bottom to top, it signals stronger bullish momentum. In this situation it is reasonable to open new long trades or increase the current ones.
When the price breaks a support line of a bullish channel, i.e. top to bottom, it means that the current upward trend is likely to reverse. In such a case, sell positions can be opened.
In the case of a bearish channel, the situation is the opposite. When a price breaks the lower boundary, it indicates continuation of a downward trend. Therefore, traders can place short positions or increase the current ones.
If the price breaks the resistance level when leaving a descending channel, i.e. it starts rising, it signals a trend reversal. In this case, long positions are recommended.
Trading during sideways market conditions
As already mentioned, price channels can be distinguished even during a flat trend, i.e. when the market is consolidating. In this situation, the channel strategy can also be efficient, though there are certain peculiarities.
Interestingly, the market is in a sideways trend for most of the time: from 50% to 80% by various estimates. Only the remaining time is characterized by active, directional market movement.
Typically, these periods occur when the current trend weakens, or when a trend takes a pause before the onset of a new active movement in the market. Generally, during consolidation, the asset's price moves within a fairly narrow horizontal channel.
During these times, market activity is minimal, so many experienced traders often advise against trading in such periods. However, there are proponents of trading during sideways markets - these are scalpers.
For traders who prefer scalping strategies, any, even the slightest price fluctuation, is of importance. That's because they carry out a large number of trades, the duration of which may only last a few seconds.
Nonetheless, there are quite a number of scalpers, as not all users have the patience and endurance to keep positions open for extended periods.
At the same time, trading during periods of consolidation carries a significant risk. No one can predict exactly how long the market will remain in a flat trend, and directional price movement can resume at any moment.
To catch this moment, it's recommended to use indicators. They also help eliminate the market noise and reduce the number of false signals on the chart.
Types of channels
We've previously discussed the principles of plotting a price channel, which mostly pertain to one type of channel. This type is known as an equidistant channel, where there are only two lines between which the price chart moves.
However, this is not the only type of price channel. There are other methods and options for constructing them, many of which are available in most modern trading platforms.
1. Linear regression. In addition to support and resistance levels, this type of channel also includes a third line that is drawn right in the middle of the channel.
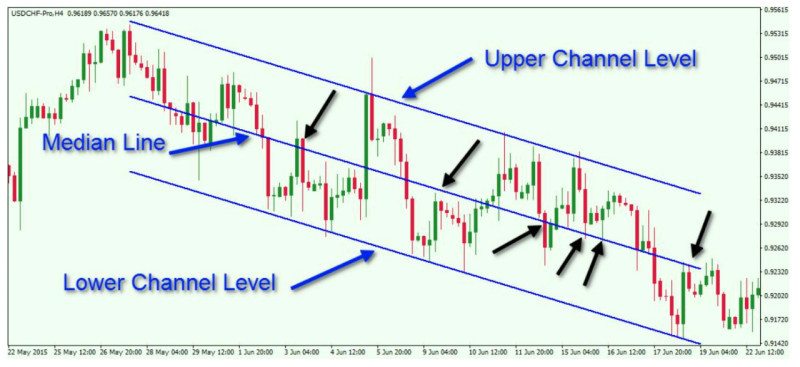
To trade using this type of channel, one should focus on the intersection of the price line with the middle line. If the price crosses it from below to above, this indicates a prevailing bullish trend. If the chart passes through it from above to below, this confirms a bearish trend.
2. Fibonacci channel. When using this method, five or six levels are drawn instead of two or three. These levels help to identify the stages of correction and trend reversal points on the chart.
According to this strategy, the potential levels of correction are 0.382, 0.618, 1.0, 1.618, and 2.618. The price crossing these lines generates rather strong signals. Besides, these levels can be used for setting stop-loss orders.
3. Bollinger Bands involves the construction of channels using moving averages. Three Moving Averages are plotted on the chart: one roughly in the middle of the chart, and the other two an equal distance above and below.
It forms a price channel, which permits short-term breaches of its boundaries. Nevertheless, only periods when the price is within the channel are used for trading. This method works particularly well when the market is in a sideways trend.
Advantages and disadvantages, specifics of the use
Trading inside a price channel in theory appears quite straightforward and comprehensible. At the same time, it has both positive and negative sides. The main advantages of this type of strategies are:
- Trading strategies based on price channels do not lose their relevance over time. Channels are constructed by the same rules over many years.
- Low trading risks.
- Simple strategy usage rules that even a novice trader can understand.
- High potential profitability provided that price channels are correctly constructed and used.
The main disadvantages of channel strategies include:
- False signals are fairly frequent.
- The trend may reverse before the price touches the upper or lower boundary of the channel. Accordingly, if a trader opens a position anticipating a bounce from one of the boundaries, the trade will be unprofitable.
- It is impossible to predict how long the chart will move within the channel. A breakout in either direction can occur at any moment, so it's best to also monitor volumes to catch this moment.
The key nuances to consider when applying this type of trading strategy include:
- Trading is recommended on timeframes no shorter than M30.
- Short-term positions should be opened after the price touches one of the channel boundaries inward.
- When constructing a price range, consider the current trend: for an ascending trend, the first boundary is drawn using two lows and one high, while for a descending trend, it's the other way round - two highs and one low.
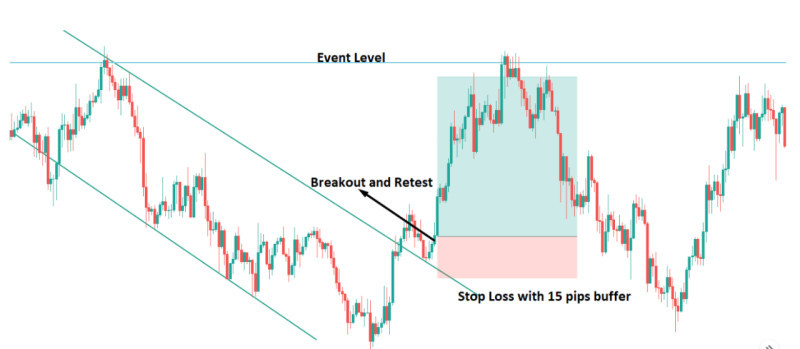
- When the chart breaks out of the channel, you can open positions for a longer term, as a rule, the potential price movement outside the channel is equal to its width.
- To hedge against losses in case of a sudden price break outside the range, you can place stop-loss orders above or below the channel boundaries.
Additional tools
While the channel Forex strategy is considered quite self-sufficient, using additional tools to confirm signals can significantly enhance the effectiveness of the strategy.
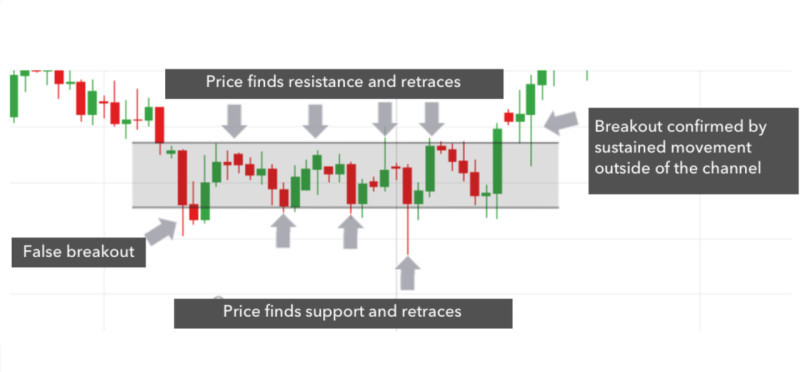
We've already mentioned that the price chart repeatedly tests the boundaries of the range it's moving within. However, at any moment, it can also break out and go beyond these boundaries.
Quite often, there are also false breakouts, when the chart moves beyond the channel boundaries but then returns to it and continues moving inside. The difference between a false and a real breakout is substantial and can cost a trader money.
If the breakout is false, the price returns inside the range after forming several candlesticks (usually 1-3) outside the channel. In case of a real breakout, the price moves beyond the channel boundary and doesn't return to this level.
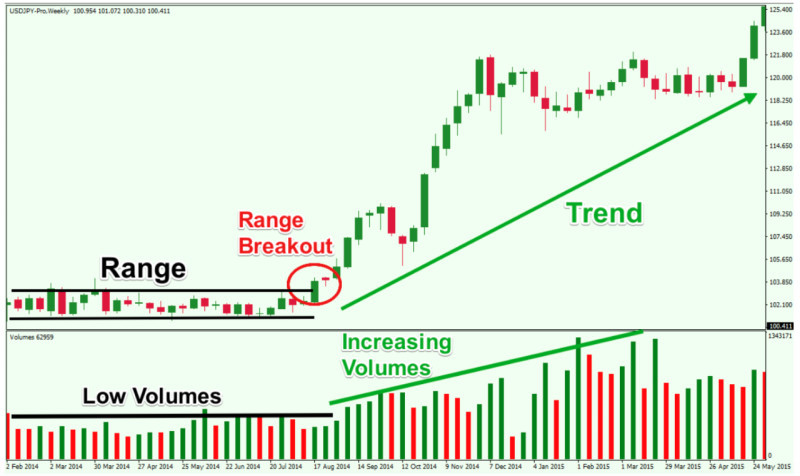
In order to ensure that a breakout is not false, various tools can be used. These include volume indicators: if the breakout is real, trading volumes will increase.
In addition, candlestick combinations or chart patterns forming on the chart can be used to confirm signals. The formation of some of them indicates the continuation of the current trend, while the appearance of others suggests an imminent reversal.
In addition to technical analysis methods, fundamental analysis can also be used. That is, monitoring major news from the world of finance and economics and assessing their potential impact on the markets.
For example, the release of corporate earnings reports, the publication of central bank decisions, and other significant events affect nearly all assets in financial markets.
A good practice when trading using a channel strategy is to use protective orders. For instance, it is recommended to set the Take-Profit not directly at the range boundary, but slightly below in case the price reverses earlier.
A stop loss, on the other hand, should be set outside the channel, slightly below support and slightly above resistance. This is done to ensure that the order does not trigger in the case of a false breakout.
Conclusion
In this article, we have analyzed the features of using channel Forex strategy. Price channels are formed quite often in the markets, as the price cannot constantly make sharp strong fluctuations.
For the most part, the price hovers inside channels formed by support and resistance lines. If the channel is constructed correctly, the price will move within it, periodically touching one boundary or another.
Traders use these movements for short-term trades to buy or sell an asset. More long-term trades can be opened in the event of a breakout of one of the levels.
However, false breakouts often occur, which should be distinguished from true ones. For this, there are various auxiliary tools such as volume indicators, oscillators, candlestick combinations, and other.
There are ascending, descending, or sideways (horizontal) channels. In the first case, the market is dominated by the bullish sentiment, in the second the bearish trend prevails, while the sideways channels means that the market is consolidating.
However, channels can be formed not only with the help of straight lines. Moving averages are also used to construct them. In this case, the boundaries of the channel are more rounded as if they follow the trajectory of the price line.
You may also like:
Support and resistance trading strategy


