A chart contains all the necessary information for a trader. All non-syndicated strategies are based on this statement.
For example, various price movements can form a pattern on the chart. In this article, we will focus on a strategy based on chart patterns.
Let us focus on various patterns and find out how to use them to trade.If you want to learn about other types of trading strategies, read “Forex Strategies”.
What is a pattern? As market conditions change, the value of this or that asset also undergoes various changes.
It moves upwards, hovers in a certain channel, and plummets.All these movements are not accidental as they directly depend on traders’ actions.
When the market is dominated by buyers or bulls, the price rises, reaching new highs.
When the market is controlled by sellers or bears, the price goes down and new lows appear on the chart.
When traders pause and are not active, the price moves within a range. Those periods are called consolidation.
However, chart patterns are not always perfect. They do not always look exactly as pictured on the Net, and they do not always work.
Sometimes there are false patterns or traders determine incorrectly what kind of pattern was formed.
It is necessary to understand that the asset price is also influenced by other factors that must be taken into account. Such factors include the release of important economic and financial news, the publication of corporate reports, and so on.
Nevertheless, the market is cyclic, and consequently, the movement of the price is periodic. This is explained, first of all, by the fact that traders' behavior practically does not change from year to year.
That is why certain regularities can be deduced from period to period. Such regularities that repeat on the chart are called patterns.
The history of long-term observations of the graphical patterns formation allows us to predict a further price movement, depending on which type of pattern it belongs to.
We will focus on the types of patterns in the next section.
Varieties of graphical patterns
During the existence of the graphical analysis, more than 200 different patterns have been discovered.
However, many of them are either too rare or difficult to identify. That is why we will consider only the most popular ones.
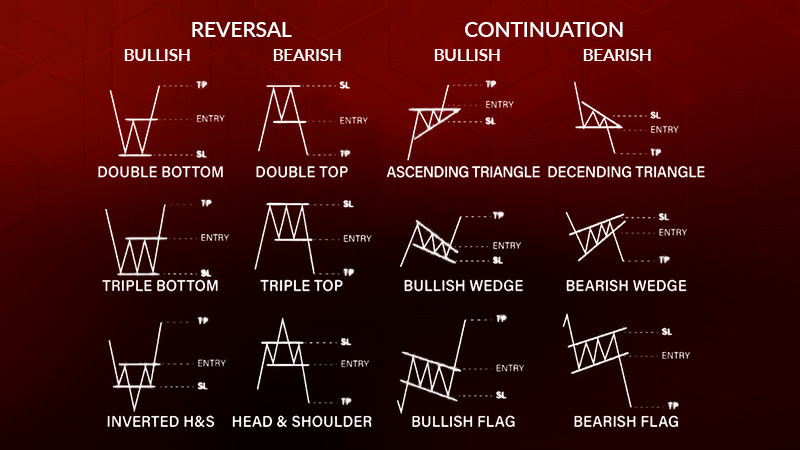
All patterns can be divided into two major categories: trend followers and reversal patterns. There are more patterns that may indicate either a reversal or continuation of the current trend.
1. Patterns of trend continuation indicate that the main trend will continue. We have already mentioned that the market has periods of movement and consolidation.
The consolidation periods appear amid the publication of important news when traders do not want to take a risk. So, if this consolidation has a form of the trend continuation pattern, the asset price will continue moving in the previous direction.
Key patterns from this category:
- Pennant;
- Flag.These two patterns are very similar to each other. They have two parts: a flagpole and a cloth. The main difference is the shape of a cloth: in the case of the Flag pattern, it is rectangular, while in the Pennant pattern, it is triangular. The profit target is determined by the height of the flagpole of the pattern.
2. Reversal patterns suggest a change in the trend from the current one to the opposite one. It means that a rise in the price will be replaced by a decline. If bears dominate the market, they will soon be replaced by bulls.The most common patterns in this group are:
- Head and shoulders;
- Double bottom;
- Double top;
- Triple bottom;
- Triple top.We will consider them in detail in the next section.Reversal patterns
Reversal patterns
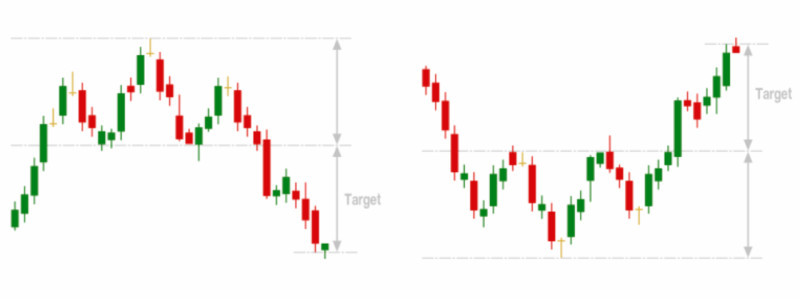
The Head and shoulders pattern is formed during a rise in the asset. It consists of three consecutive maximums, with the second (“head”) higher than the two adjacent ("shoulders"). The "neck" line is drawn on the lows of this pattern.

The profit target is determined by the height of the pattern, i.e., the distance between "head" and "neck". The inverted Head and shoulders pattern, which is formed in the same way, but amid the downtrend, is considered a mirror model.
The pattern is supposed to be one of the most reliable and can be formed in any time frame. In this case, the Head and shoulders pattern is formed within several weeks, while the inverted figure is formed for several months or even a year.
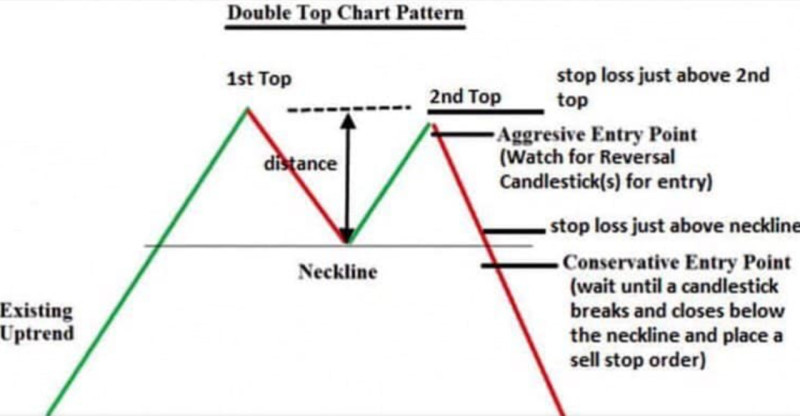
The Double bottom and Double top patterns are completely similar but look mirror-like. Double top is formed in case of an uptrend and indicates its change to a downtrend. The pattern consists of two peaks on the same level.
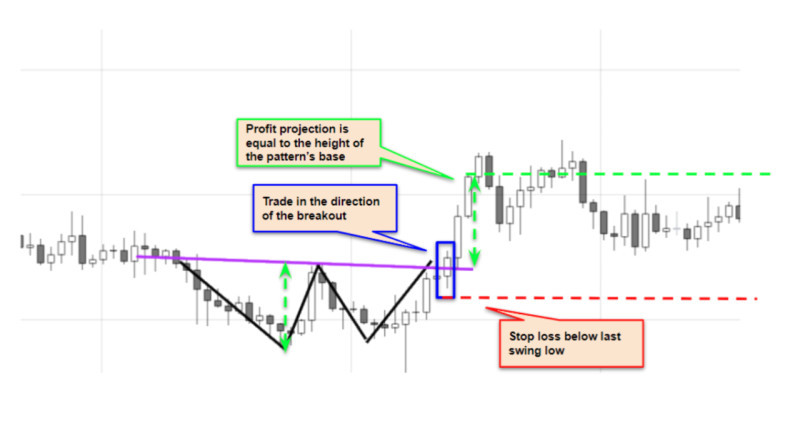
Double bottom is formed in the same way, but during a bearish trend and indicates the beginning of a rise. Profit targets in both patterns, as in the case of Head and shoulders, are determined by the height of the figures.
These two models are considered reliable. However, it is also necessary to take into account the distance between two consecutive peaks/dips. It should not be too small. At the same time, Double bottom appears in the charts more often than Double top.
When the Double top or Double bottom patterns do not occur, it may indicate the formation of the following patterns: Triple top and Triple bottom. One more additional high or low is added to them.
These two figures are met less often than their double versions but they are considered more reliable. They are like an extension of the double patterns. Thus, if the double pattern may not work, the triple pattern will work for sure.
Pattern Strategy
How to use a graphical pattern in trading? There are various strategies. The fact is that graphical patterns, unlike technical indicators, do not provide specific signals for entering the market.
That is why there are several strategies based on the usage of patterns. Conservative and aggressive strategies are the main ones. Let us analyze them in detail using several patterns from the previous sections.
For the Head and shoulders, Double top, and Triple top patterns, a conservative strategy implies opening a position only after a pattern is confirmed.

Such confirmation may be obtained when the price upwardly crosses the support line and continues falling. Then, the price returns to this level again, but now it is acting as resistance. If the price cannot cross it, it keeps falling.
However, it may also happen that the price does not return to the previous level to test it again. In such a situation, the opportunity to open a position and, accordingly, to make a profit will be missed.
In aggressive trading, the entry into the position is carried out immediately at the moment of crossing the support level by the chart. This step may be quite risky in case the pattern does not work out.
It is also possible to confuse the double and triple patterns and open a trade after the formation of the second peak. If the pattern forms a third peak, a trader will remain out of the market.
Similarly, mirror models are used only in the opposite direction: inverted Head and Shoulders, Double Bottom or Triple Bottom. Those who apply a conservative approach, have to wait for the complete formation of the pattern and the subsequent return of the price to the resistance level, which becomes support.
In case of aggressive trading, traders open a position just after the price crosses the resistance level. However, it can be done too early if a triple pattern is formed instead of a double pattern.
There are even more aggressive trading strategies when a trader opens a positions at the beginning of the pattern formation. However, as we have already mentioned, many patterns are similar to each other during their formation. That is why it is easy to make a mistake.
Strategies using protective orders
There are enough reasons to set protective orders when trading with the help of graphical patterns:
- In the process of their formation, the models are similar to each other. If a trader confuses one reversal pattern strategy with another, there may not be any problems. However, if a trend continuation pattern is confused with a reversal pattern, it will inevitably lead to losses;
- Patterns may not form or work incorrectly. On the trading charts, figures may not always look as perfect as on the Net. Besides, we have already mentioned that there are patterns, which are the continuation of other patterns;
-Sometimes traders think that they see patterns but they are mistaken. This often happens with beginners. They see chart patterns everywhere, even where there are none.
We have already mentioned a profit target several times. This is nothing else but a take profit order. The highest level at which it can be set is equal to the height of the formed pattern, that is, the distance from the high/low to the "neck" line (support/resistance).
Some users prefer to place take profit orders slightly below the full height of the pattern, for example, at the level of 80% of the chart height. Such orders help traders to fix a profit in case the market turns back or the price does not reach the maximum point.

The second most known protective order is stop loss. It is most effectively placed at a level just below or above the "neck" line. Exactly, it will protect from losses in a situation when the pattern is incorrectly determined or does not work.
Protective orders are often used by short-term traders. Investors and long-term strategists use them rather rarely. However, this is always a personal choice and depends on a trader's openness to risk.
Confirmation of Pattern Signals
No matter how reliable the method of analysis and the signals are, it is better to check them.
In the case of graphical patterns, the first thing to check is whether the pattern is formed correctly. There are certain rules for the formation of each pattern.
For example, during the formation of the Flag pattern, it is necessary to pay attention to the following factors:
1. The formation of the pattern strategy is preceded by a strong movement, which forms a "flagpole";
2. Note that a bullish Flag is headed downwards whereas a bearish Flag is headed upwards;
3. The height of price fluctuations within the flag should not exceed 50%. Ideally, it is less than 38% of the length of the "flagpole", i.e., the initial movement;
4. Once the correction is completed, the trend should continue in the same direction as before;
5. The most correct entry point appears when the price goes through one of the boundaries of the flag.
Similar rules exist for other patterns.
For example, in case of the Double bottom pattern, a bounce off first trough should be at least 10-20%.
It is also important to have at least 7 candlesticks between the first and the second bottom.
However, this is not the only way to check signals of a graphical pattern. It is also possible to use a bigger time frame.
If the pattern is formed in a small time frame, you need to check how things are in a bigger one.If a signal is confirmed in a bigger time frame, you can be sure that a trade can be opened in a shorter time frame, which is often the working time frame for traders.
Another reliable way to check the correctness of the graphical pattern formation is the appropriate candlestick combinations.
If candlesticks also appear on the chart, the signal can be considered reliable.
Automation
You already know that a subjective component is one of the main difficulties in pattern trading. Different users, depending on their knowledge and experience, can see different patterns on charts.
This is especially true for beginners who tend to find patterns everywhere, even in places where they are nowhere to be found.
One way to solve this problem is to study the topic in-depth and practice identifying patterns.However, there is another problem.
At the beginning of their formation, some patterns are very similar to each other.
Thus, it is possible to make a mistake when opening a position if you are wrong in forecasting which pattern will be formed on the chart.
The automated programs recognizing graphical patterns have been created exactly for traders to dispel any doubts.Such programs have strict criteria for finding patterns on the chart.
Moreover, they can also determine a further price movement and set targets.
Once a pattern strategy is detected on the chart, the program gives a signal to the user. Then, traders can make decisions about opening a position.
There are currently a sufficient number of such programs so that each trader can choose the best one.
ConclusionIn this article, we focused on pattern strategies. They can be conservative or aggressive.
Regardless of the chosen strategy, it is necessary to be attentive to the correctness of the pattern formation on the chart.
It is best to use additional tools to check the accuracy of signals from the pattern.
First, make sure that all the necessary conditions are met during the formation of the pattern.
Secondly, check it using a bigger time frame. Thirdly, look for candlestick combinations as a signal confirmation.
However, even experienced traders are not always able to distinguish one pattern strategy from another during the formation phase as many patterns are similar to each other.
In order to facilitate the process, apply special programs that automatically find and identify patterns on the chart.
You may also like:
Support and resistance trading strategy


 Back to articles


