


Many traders believe that the situation in the market can only be analyzed by using technical analysis indicators. However, this is not entirely true, and it is possible to analyze the market without them.
In this article we will look at various methods of market analysis and forex trading without indicators strategies that do not employ technical indicators.
You can learn more about other trading algorithms and how they can be used in the article "Forex Strategies".
Strategies using forex trading without indicators
There are two kinds of traders on the market:
- Those who prefer to use indicators to analyze the situation in the market.
- Those who use other strategies without employing indicators.
First, let us have a look at analyzing the market by using indicators. Each of these indicators are using a certain algorithm that allows analyzing the market based on the changes of the asset's price or trading volume.
The position of indicators is adjusted automatically when these factors change.
Most popular indicators are already integrated into trading platforms. The user only needs to select one or more indicators and add them to the chart.
The analysis is performed automatically in a matter of seconds, giving the user a picture of what is happening in the market. Depending on the signals received, the trader can decide whether to open a position or stay out of the market.
There are two most frequently used groups of indicators - trend indicators and oscillators. Experienced traders recommend using several indicators from these two groups simultaneously.
There are no indicators that would be ideal on their own, so the best course of action is to use additional indicators to confirm or filter out each other's signals.
However, you should know what combinations of indicators work best and do not add too many of them. Putting too many indicators on one chart will only confuse you.
Another effective method is to use the same indicator on different timeframes. So, if a signal appears on a lower timeframe, it is a good idea to test it on longer timeframes.
Analysis without using indicators
Supporters of this method claim that the chart itself contains all the necessary information. Therefore, almost no additional tools are needed.
But how can we analyze the chart based only on its own data? There are several ways of doing it. Let us examine them in more detail below and in the following sections.
The main assumption of these strategies is that the market is cyclical. People generally behave the same way, so history repeats itself.
The first important thing to consider is the type of chart or the way it is displayed. For example, candlestick and bar charts can give a trader much more information than a simple line chart.
Many traders prefer to use a candlestick chart to track price changes of an asset. This is because some types of candlesticks or their combinations can provide the user with signals about the price's movement.
The only problem, especially for beginner traders, is that there are a lot of different types and patterns of candlesticks. It is quite difficult to memorize all of them. Alternatively, you can make a cheat sheet of the most commonly encountered patterns.
In addition to candlestick analysis, it is also possible to analyze the market by using chart patterns. The value of the asset tends to reproduce its previous movements, so various patterns periodically appear on the chart.
The patterns can show whether the trend is changing or continuing. There are much fewer chart patterns than candlestick combinations, so it is easier to use them.
On the other hand, if you lack experience and the required knowledge you may misidentify patterns or mistakenly see a pattern when it does not exist.
Price Action strategy
Price Action is one of the most frequently used strategies that do not use indicators. It incorporates both candlestick patterns and chart patterns.
As previously mentioned, candlestick patterns can be formed by a single candle or by several candles, usually up to six. However, in the case of chart patterns, the number of candlesticks may reach several dozens.
Therefore, the number of combinations that can be used in this strategy is very large. Nevertheless, it will give good results if the trader uses even the simplest patterns correctly.
The most important patterns for a trader are reversal patterns, which signal upcoming trend reversals. There are some patterns that appear on the charts more frequently than others. Traders should pay particularly close attention to them.
These patterns include, but are not limited to:
- Pin bar;
- Inside bar;
- Outside bar.
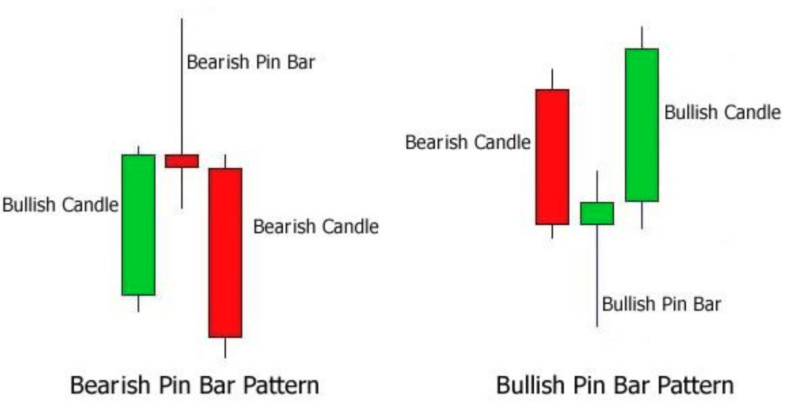
A pin bar is made up of three candlesticks. Many users believe that it gives strong signals. The pin bar itself is a candle with a small body and two shadows: a long one and a short one.
To give a reversal signal, the highest point of the pin bar shadow must be higher than the highs of two nearby candlesticks (for bearish pin bars), or lower if the trend changes in the opposite direction.
The Inside Bar pattern consists of just two candlesticks, with the second candlestick being smaller than the first. The second candle seems to be fitting inside the previous one.
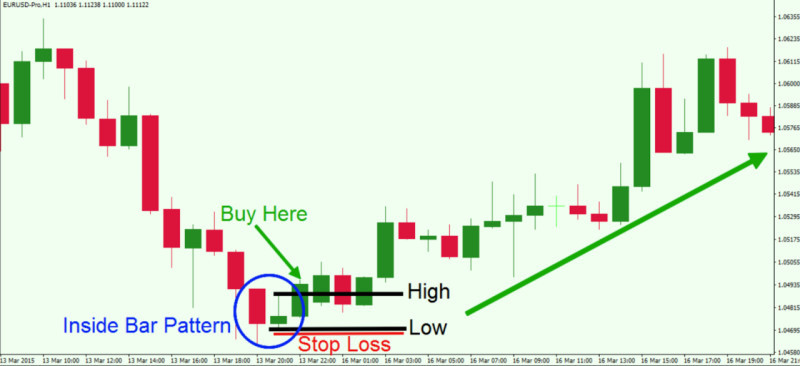
If the inside bar is red, it indicates a bearish reversal. If the second candle is green, it confirms that the trend is about to reverse upwards.
The Outside bar is also called a bearish/bullish engulfment, and it is also formed by two candlesticks. In this case, the second bar is larger and sort of absorbs the preceding one.
In a bearish engulfment, the larger red candle absorbs the smaller green one, and the trend changes from a bullish to a bearish one. During a bullish engulfment, the opposite is true.
Chart patterns
Forex strategies without indicators that use chart patterns are quite popular among users. They do not require any additional tools, only the knowledge and attention of the user.
There is a fairly large number of chart patterns. However, not all of them can be used during trading.
Here are the most frequently occurring patterns:
- Head and shoulders;
- Double/triple top;
- Double/triple bottom;
- Pennant;
- Triangle.
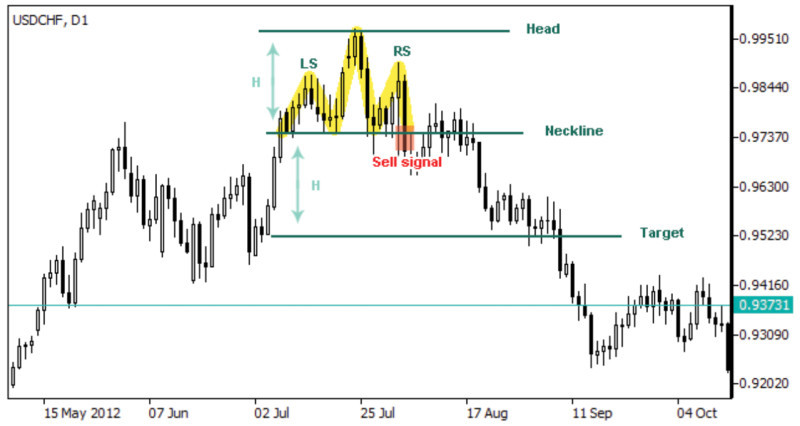
The head and shoulders and double/triple top patterns are very similar to one another, particularly when the first shoulder or top is formed. They are both reversal patterns.
The only difference between them is that during the first pattern the "head" is higher than the "shoulders", while all the tops are located at approximately the same level. All these patterns indicate a bearish reversal.
The entry point is when the asset crosses the "neck" line on the chart, i.e. the support level of one of the above-mentioned patterns.
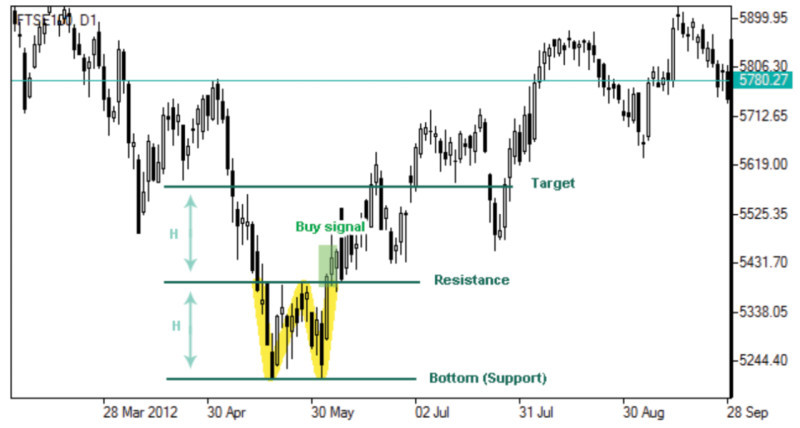
The inverse head & shoulders and double/triple bottom patterns, on the other hand, signal that the trend is about to reverse upwards.
The entry point is, once again, the chart line crossing the "neck", in this case the resistance level. The profit target is set at the highest level of the pattern.
The pennant pattern shows the current trend will likely continue. It emerges when the market is in consolidation and the asset is moving within a narrow range on the chart. However, the strength of price fluctuations is not enough to change the current trend.
In this case, the asset continues to move in the same direction as before after exiting the range. The entry point for opening a position is the moment the asset crosses one of the borders of the channel, with a profit target set at the highest point of the Pennant pattern.
A Triangle pattern can be ascending or descending. If it is ascending, the trend is likely to reverse upwards, and vice versa.
The entry point is the moment when the line on the chart exits the pattern, and the profit target is set at the level that equals the widest part of the pattern.
Advantages and disadvantages
Trading strategies without the use of indicators have both pros and cons. Let us analyze them in more detail in this section.
Here are the main advantages of strategies that do not use indicators:
• They do not become obsolete, unlike indicator strategies. Technical indicators are automated, so their methods and the software side can become outdated. Meanwhile, candlestick analysis methods have been around for centuries and still remain relevant.
• The signals they provide are more accurate. However, it depends on the proper interpretation of the situation on the chart. Technical indicators may lag behind and give false signals for entering positions. Non-indicator analysis provides more reliable signals, because a person can take into account more factors than the program.
• They signal price movements in advance. The formation of certain kinds of chart and candlestick patterns indicates upcoming trend changes. If these patterns are promptly identified, the trader can maximize their profits.
• Gaining experience. When technical indicators are applied to a chart, the trader does not have to analyze it on his own. Chart and candlestick patterns require the trader to learn how to "read" the chart and notice important changes on it.
Here are the main disadvantages of strategies that do not use indicators:
• They are subjective. Each trader can see various patterns on the chart according to their knowledge and experience. Different users can see different patterns on the same chart, and will therefore act differently. In addition, some patterns look approximately the same when they begin to emerge, and the user may get them mixed up.
• They require extensive knowledge. In order to distinguish between different candlestick and chart patterns, they need to be learned. The formation of certain patterns and candlestick combinations occurs according to certain rules, and the user should know and remember them. In addition, it is necessary to take into account fundamental factors, such as the latest events.
• There are no specific entry points. Technical indicators give traders specific points on the chart for opening a position. The same cannot be said for the chart and candlestick models. The user has to determine when to open positions by themselves.
How to use strategies that don’t use indicators
In order to successfully use these strategies, you should follow a number of rules. The main rules are listed below:
1. Remember that the chart already contains all the necessary information. You only need to know how to read it correctly and identify the patterns that appear on it.
2. The market moves cyclically, therefore chart patterns and candlestick combinations are periodically repeated. Study the basic patterns, practice looking for them on historical charts.
3. Use proper risk and money management. Do not make large transactions, as they are risky. A single position should use from 2% to 5% of your deposit. If you're a beginner, it's better to stick to 2%, while more experienced traders can invest more money.
4. Study the correlation of adjacent elements on the chart, especially in candlestick patterns, where numerous combinations are formed by 2-3 candlesticks.
5. Non-indicator methods of analysis are often ahead of the curve. You need to learn which patterns indicate an upcoming trend reversal, and use them to maximize your profits.
6. Create your own trading strategy, which will allow you to have precise rules for when to open a position in different market situations.
7. If you prefer an aggressive trading style, choose your entry point immediately after the formation of a certain figure on the chart. If you prefer a more conservative approach, you can wait for the chart to return to the breakout level of the pattern and take advantage of it.
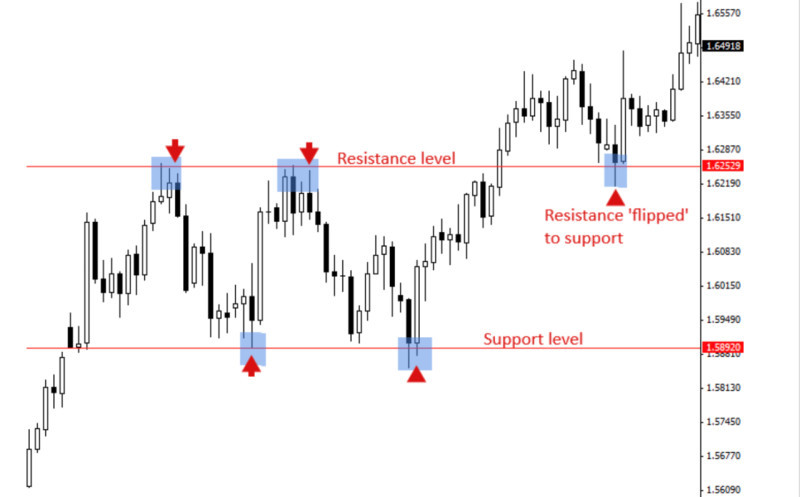
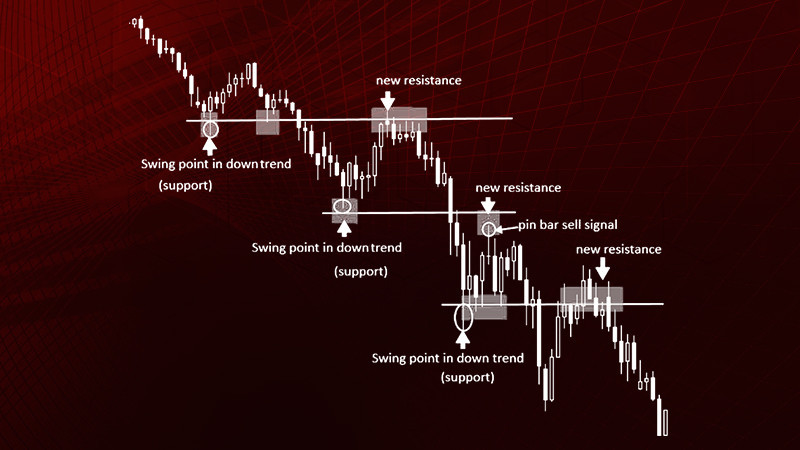
8. Mark support and resistance lines on the chart. They will help you get spot key points when the price is approaching these levels and can break through them.
9. A great advantage of strategies without indicators is that they can easily be combined with each other. You should take advantage of it. When you notice a reversal pattern, look for reversal candlestick patterns that would confirm this signal.
Conclusion
In this article, we looked at forex trading strategies without indicators. They use a different way of analyzing the market than strategies that rely on indicators.
Indicators are already built into modern trading platforms and are quite easy to use. They are overlaid over a chart and provide trade signals.
At the same time, indicators tend to lag and also become outdated along with the underlying software. Strategies that do not involve indicators are superior in these respects.
Many generations of traders have been using them for years, and they have not become obsolete. Many chart patterns and candlestick combinations can actually be ahead of the curve and indicate an impending trend reversal.
Such strategies rely heavily on the human factor. A lot depends on the knowledge and experience of the trader who is viewing the chart. You will not be able to use such strategies if you cannot read charts and notice the important changes on them.
This is both an advantage and a disadvantage. If the trader does not have enough knowledge and experience, they will either mistakenly notice non-existent patterns, or fail to see actual patterns emerging on the chart.
However, good profits can be made if a trader recognizes chart patterns and candlestick patterns on the chart at the right time. Strategies that do not use indicators can be easily mixed and matched.
You may also like:
Support and resistance trading strategy


