


No technical indicator can provide complete, reliable information about the situation in the market. At the same time, not every trader can perform high-quality analysis using several tools at once.
In such situations, combined indicators, which include two or even more analytical tools, come to the aid of traders. Arrow indicator advisor are one particularly notable example of them.
This article will cover arrow indicators and expert advisors based on arrow indicators in detail. More information on expert advisors and their key features can be found in the article "Forex Eas."
Technical indicators
Thanks to the development of information technology, financial market trading has become a very common and popular activity. Earlier, opening a single transaction required analyzing the market situation manually.
Traders made calculations on paper, drew trading instrument charts by hand and overlaid all the necessary information on them by themselves. Nowadays, all this is done automatically, which greatly simplifies the work of a trader.
Analyzing the current market situation can be done in different ways. Some traders believe that the asset’s chart already contains all the necessary information.
Thus, they prefer to use chart analysis alongside candlestick analysis. Before opening a position, they wait for the formation of certain chart patterns, which are confirmed by candlestick patterns.
Others prefer to use technical analysis, often combining it with fundamental analysis. Technical analysis employs additional tools that are added to the chart and help determine the situation in the market.
Various types of indicators are used in technical analysis, each of them performing certain tasks. Depending on said tasks, indicators can be subdivided into several categories:
1. Trend indicators are used to determine the current direction of price movement. The most well-known such indicator is the moving average (MA) and its different versions.
2. Oscillators determine overbought and oversold levels of a particular asset. They are leading indicators and are often used together with indicators from the first group.
3. Flat indicators are used when the price of an asset is moving within a certain range or channel and does not move in any clear direction.
4. Arrow indicator advisor incorporate tools from the three preceding categories. The following sections will cover these indicators in more detail.
What are arrow indicators?
No technical indicator cannot provide enough information about the current state of affairs on the market by itself. This is because indicators are imperfect and have both their advantages and disadvantages.
Some of them tend to lag and cannot reflect the current situation on the chart. Therefore, such indicators should be always used alongside other tools that will filter their signals.
Other tools are generally used as add-ons. By itself, the information from such indicators will not help the user in any way. However, it might come in handy when combined with data from other indicators.
Using technical indicators to find entry points to a position can be quite difficult for novice traders. This is because most indicators have quite complex conditions for opening trades.
In many cases, several conditions must be present at once. For example, several lines must cross each other, or the asset must pass through certain levels on the chart.
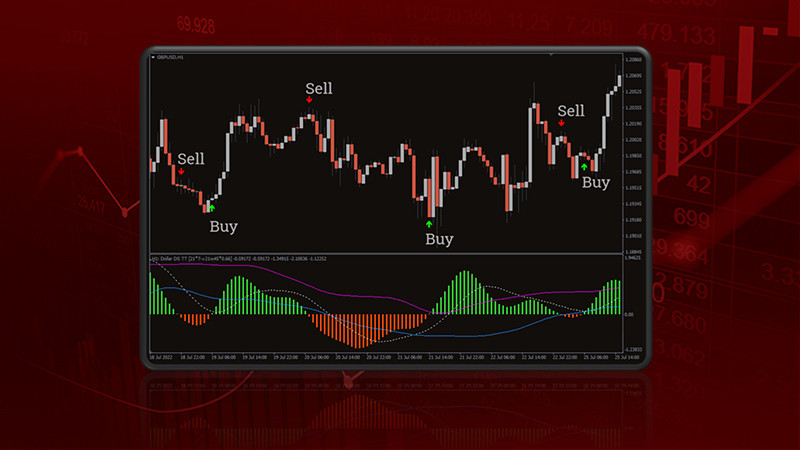
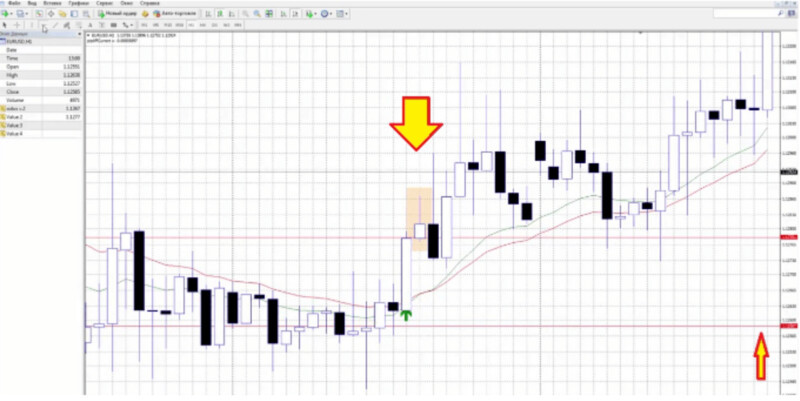
Arrow indicator advisor can clearly and unambiguously show such entry points by marking it with an arrow or other symbols.
Such indicators use readings of several instruments at once in their calculations. They do not clutter the chart with multiple different symbols and lines at the same time, which can sometimes happens when using several indicators at once.
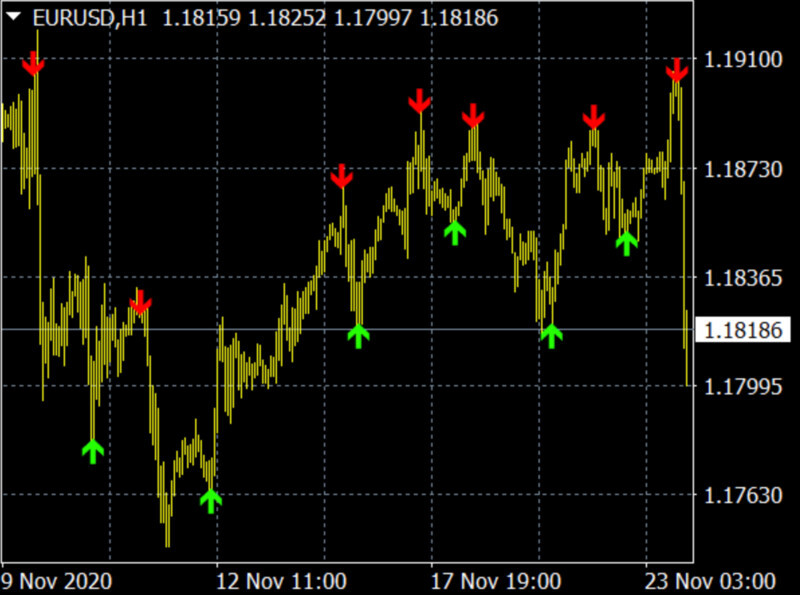
When a green arrow appears on the chart, it indicates a potential entry point for long positions. Conversely, a red arrow indicates a potential opportunity to open a short position.
Repainting indicators
While arrow indicators might seem to be an ideal tool, they have certain peculiarities that can complicate their usage. One of such issues is repainting.
Indicators affected by repainting flip between various states - for example, an indicator may jump between various candlebars.
Arrow indicators take into account a certain number of candlesticks during calculations. When a new candle is added, an older one is removed.
The resulting calculation adjustment can flip the indicator’s signal. It primarily depends on the time frame chosen by the trader.
In the M1 timeframe, new candles are created every minute, while in the M15 time frame, new candles are added every 15 minutes.
The faster new candles are added to the chart, the quicker the arrow indicator might flip. By constantly flipping from buy to sell, the indicator might confuse any trader looking for an entry point into the market.
Some arrow indicators are not affected by repainting and do not create any confusion for their users.
Advantages and disadvantages of arrow indicators
Before figuring out which expert advisor using arrow indicators to choose, let us take a look at the main advantages and disadvantages of these tools. The main advantages of these indicators are the following:
• They combine the readings of several instruments at once into their calculations. Usually, arrow indicators combine the readings of moving averages, MACD, RSI, and other instruments. There is no need to overlay each of them on the chart separately.
• They do not make the chart look cluttered. Even novice traders can orient themselves in its signals and indications, as there are no multiple indicators on it at once.
However, they also have a number of disadvantages:
• Repainting is one of the most significant weak points of this tool. It may be difficult for the user to determine the entry point because the arrows sometimes skip from one candlestick to another.
• They are not suitable for all trading strategies. For example, due to repainting, this tool cannot be easily used for short-term strategies, particularly scalping. Therefore, it is better to use it for medium- and long-term trading in the higher time frames, starting from H1.
• They are not universal tools - there is no indicator that would suit everyone and every single trading tactics. Some arrow indicators are better suited for trading in flat market conditions, while others are better used when the asset has momentum.
• Arrow indicators require additional application of fundamental analysis methods. Just looking at readings of technical indicators is not enough - you will need to confirm the signals with the help of fundamental analysis.
Examples of arrow indicators
Among the huge number of arrow indicators, there are those that have proven themselves to be highly effective. They have been used by many traders for quite a long time and have produced good results.
Let us take a closer look at some of them and note their key features, advantages and disadvantages.
1. Sidus is a combined tool based on two technical indicators, the RSI and the Moving Average. The indicator combines their readings and provides buy or sell signals. It is recommended to use it in the H4 timeframe when trading the EUR/USD currency pair.
2. T3MA-Alarm is an indicator based on several moving averages. This tool is suitable for trading any currency pairs, and its recommended time frame is M30.
3. Super Point Signal - one of the few effective arrow indicators suitable for scalping. It can provide good results in short time frames (M1-M5) and can be used with any currency pairs.
It should be noted that despite their versatility and the fact that they already combine several indicators, arrow indicators are still not perfect. Like many other tools, they should be used alongside other indicators which would add additional information and confirm their signals.
Expert advisors and trading bots
The script of Expert Advisors enables automation of most trading tasks, simplifying the process and freeing up a lot of time for the user.
Generally, such programs are assigned to perform some routine tasks that take a lot of time for a human. Expert Advisors can fulfil them in couple of seconds.
There are some different opinions regarding the difference between Expert Advisors and trading bots. Some say that Expert Advisors trade only currency pairs, while bots can trade any assets, from stocks to commodities.
However, we believe that there is another way of distinguishing these programs. Expert Advisors are designed to analyze the market, after which they can provide the user with a signal about a favorable moment to open a trade. This is why they are called advisors.
The second category, trading bots, have a more extensive range of features. Besides analyzing the market and searching for entry points, they can also execute trades on behalf of the trader. For this reason, they are considered to be fully automatic programs, while Expert Advisors are called semi-automatic.
Allowing the bot to use your account and your funds is a matter of personal preference. Most experienced traders, however, do not do this or carefully monitor the performance of their trading bots.
This is because these programs can malfunction or fail to take into account any sudden changes in the market. In such situations, it is necessary to reconfigure them or disable some features such as automatic trading.
How to select an Expert Advisor
Every Expert Advisor and indicator is based on specific trading algorithms. These algorithms are their distinctive features.
Many traders, especially beginners, often look for a miracle program that will bring fantastic profits. However, as they gain experience, they realize that there is no such thing.
Every Expert Advisor and every indicator has both advantages and disadvantages. Even profitable and effective Expert Advisors can fail over time and require some tweaks.
So, how should you choose an Expert Advisor or trading indicator? Here are the basic guidelines:
- Indicators and Expert Advisors simply reflect the current situation in the market, without stating the reasons behind the events in the market and providing any recommendations for further action. All of this remains at the discretion of the trader.
- Traders should clearly understand how the instrument performs its calculations. There are lagging indicators, and there are indicators that are ahead of the market (leading indicators).
- You should configure an indicator or Expert Advisor before using it. Despite the fact that there are tools that are designed for trading a particular asset or in a given timeframe, most such programs can be used with any asset and in any time frame. Their effectiveness entirely depends on user-specified settings.
How to set up Expert Advisors and indicators
Why do some users get excellent results with Expert Advisors based on arrow indicators, while others lose their deposits? As mentioned earlier, choosing a good Expert Advisor is not enough. You also need to configure it correctly.
It is difficult to determine any ideal settings for a particular tool. It largely depends on what asset the trader plans to trade, the time frames, and other parameters.
Nevertheless, each instrument has certain default settings, and many users are afraid to change them in order not to disrupt the work of the Expert Advisor. However, only the trader themselves can find the most suitable settings for them, and only based on their experience.
In order to tweak the performance of an indicator or an Expert Advisor, you should do the following:
- Test it on historical data and see the tool's underlying principles and performance patterns.
- Testing the EA’s performance will also reveal if its signals are lagging or leading.
- You should choose a time frame in accordance with the trading strategy that suits you.
- Change various parameters until you get the optimal number and frequency of signals from the Expert Advisor. For some trading algorithms it is necessary to receive signals every 5 minutes, while for others it is 3-4 times a day.
- After modifying the Expert Advisor’s settings, you should once again test its performance using a demo account.
- Continue to monitor the work of the Expert Advisor and change its settings if necessary. For example, an increase in the number of triggered Stop-Loss orders suggests that you need to revise the tool's parameters.
Selecting an arrow indicator
How to choose a reliable, working arrow indicator? Some basic guidelines to follow are listed below:
- Choose the instrument that fits your trading strategy. As mentioned earlier, arrow indicators are not universal tools. Each of these indicators is better suited for different strategies.
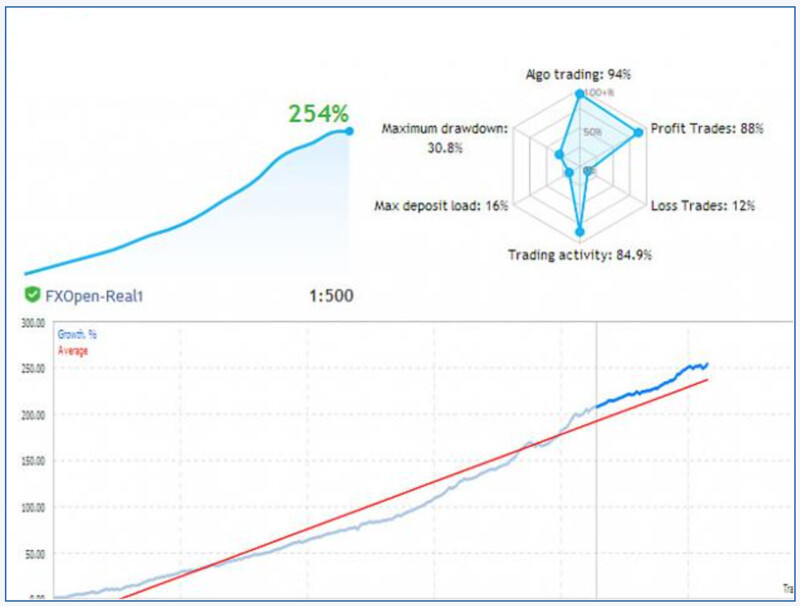
- Perform some preliminary testing using a demo account. Regardless of claims made by the developers about how efficient their tools are, they should always be tested. You should perform testing on at least 100 trades, and the indicator's efficiency should be at least 70%.
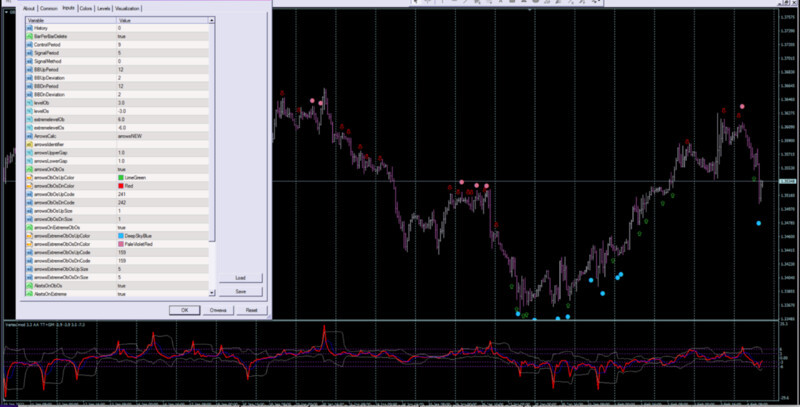
- Study the indicator’s source code, which should be made available to users. Firstly, this will allow you to understand the basic principles of the indicator's functionality. Secondly, it will allow you to make changes and adjustments later on, if necessary.
One of the key features of Expert Advisors utilizing arrow indicators is that they work more effectively when there is clear momentum in the market. When the market is flat, such tools can produce inaccurate signals.
There are a lot of such Expert Advisors, so you can try to use them alongside one another, as well as combine them with other tools. You can also try to use different time frames and adjust their settings.
However, you should remember that the best Expert Advisor is the one which is created by you personally, or the one which is based on your trading strategy. Doing so is more difficult and costly, but the most effective.
How to create an Expert Advisor based on arrow indicators
When you have sufficiently optimized your trading strategy, perfected it, and are able to make profit with manual trading, you may consider automating it.
Almost any tool can be used for creating an Expert Advisor, and arrow indicators are particularly suitable for automation.
You will need to select the desired indicator and add it to the chart. If the required tool is not included in the trading terminal's toolkit, it can be downloaded from the Internet and installed separately.
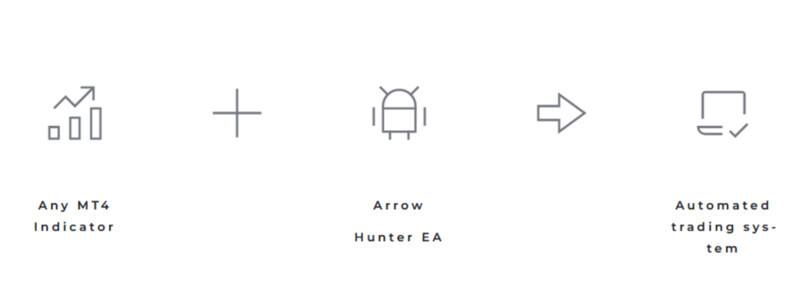
To convert an indicator into an Expert Advisor, you will need a special script, which can also be found online. After opening the script, you will get a detailed, step-by-step instruction on creating an EA.
During the process of creating the tool, you will need to set the basic input parameters for the Expert Advisor.
However, you will not be able to use the newly created bot immediately. To do so, you will need to download it and add it to the platform’s Expert Advisors folder.
There are many programs which can be used to create your own technical indicators, scripts and trading bots. Most well-known trading platforms also have such features.
Furthermore, the editors themselves contain ready-to-use code templates, in which you just need to substitute your own data and get a ready-made program. Tutorials, manuals and tips can also be found quite easily.
Conclusion
In this article, we have looked at the key features of arrow indicators, their advantages and disadvantages. This group of indicators can be used even by novice traders, as their signals are very simple and unambiguous.
Nevertheless, many of these indicators tend to repaint - they change their signals as soon as new candlesticks are formed on the chart. It may confuse users, so traders generally try to find indicators that do not repaint.
Arrow indicator advisor are well suited for automation, and it is easy to create expert advisors based on them. However, before you create an Expert Advisor based on an arrow indicator, you should have a well-built trading algorithm.
When selecting an indicator for creating an Expert Advisor, you should take into account its features, how much it matches your trading strategy, and also carry out preliminary testing.
However, besides choosing the right indicator or Expert Advisor, you should customize it and selecting the right settings for all key parts of the tool.
The same tools can produce completely different results for different users because of differing settings. Therefore, each Expert Advisor should be customized before use and reconfigured later, if necessary.
You may also like:


