GBP/USD 5M
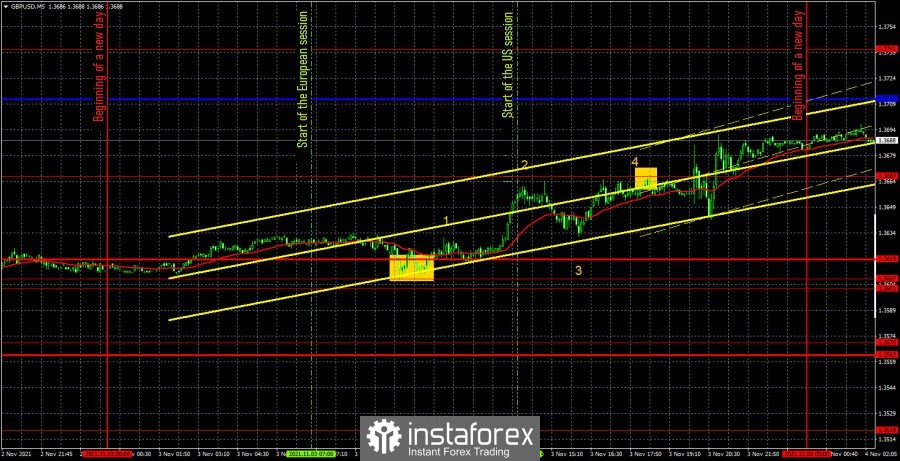
The GBP/USD pair traded rather sluggishly on November 3. The volatility of the environment was up to the moment of publication of the results of the Federal Reserve meeting, which is very little for the pound. And this despite the fact that there were quite important macroeconomic publications in the US during the day, and Bank of England Governor Andrew Bailey made a speech in the UK. However, the markets did not find it necessary to process this information. As we can see in the chart above, only the ISM service business activity index could theoretically influence the pair's movement, since it was at this time (the number "3" in the chart) that the direction of movement changed. However, the problem is that the ISM index turned out to be more positive than the analysts' forecasts, and rose to 66.7 points in October. Thus, after its publication, the dollar was supposed to rise in price, not fall in price. All other events of the day did not cause any reaction from the markets at all. The number "1" - business activity in the UK services sector. The number "2" is the US ADP report. Number "4" - Bailey's speech. As a result, it remains for us to consider only trading signals that were formed during the day and remind that we do not recommend considering signals in the evening, since lower timeframes involve intraday trading. Consequently, before the evening FOMC results were published and the press conference with Jerome Powell. Traders should have already left the market anyway. However, they did just that if they followed our recommendations. During the day, only one buy signal was generated when the price bounced off the 1.3607 level. After that, the pair went up about 40 points and stopped near the extremum level of 1.3667, from which it rebounded with an error of 1 point. It was at this moment that long positions should have been closed in a profit of about 30 points. Thus, despite the strong "foundation" and "macroeconomics", only one signal was formed, which made it possible to earn, despite the weak volatility.
GBP/USD 1H
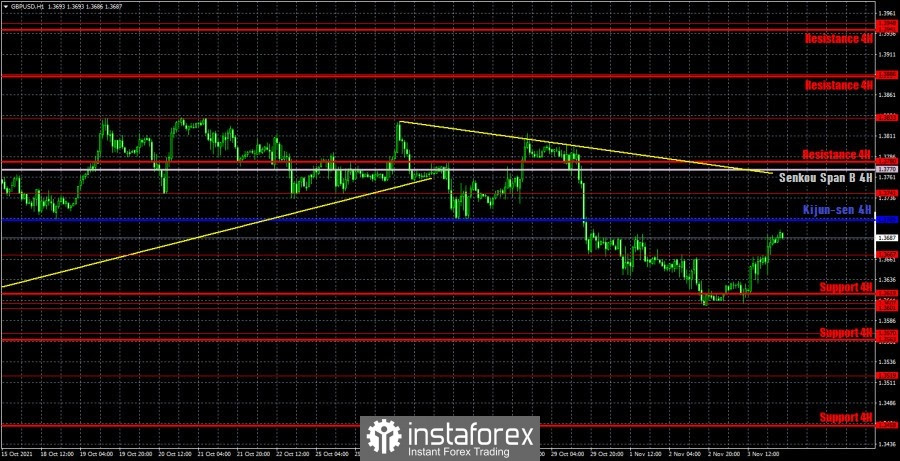
On the hourly timeframe, the pound/dollar pair is trying with all its might to continue the downward movement and even formed a downward trend line, which, however, it has a very small slope and is therefore, weak. However, the very movement of the pair in recent days is also not distinguished by special strength. So far, the downward trend continues, but it practically does not limit the pair in a possible upward movement. On November 4, we distinguish the following important levels: 1.3519, 1.3570, 1.3601 - 1.3607, 1.3667, 1.3741. Senkou Span B (1.3770) and Kijun-sen (1.3709) lines can also be signal sources. It is recommended to set the Stop Loss level at breakeven when the price passes in the right direction by 20 points. The Ichimoku indicator lines can move during the day, which should be taken into account when looking for trading signals. The results of the Bank of England meeting will be summed up in the UK on Thursday. And this is undoubtedly the most important event of the day. Everything will depend on whether important decisions are made by the British central bank, or whether at least its rhetoric changes in a slightly more hawkish direction? If not, then the markets may not react in any way to this event. We also have Bailey's speech today and a report on business activity for the construction sector. Thus, in general, the fundamental background may be strong today, but the market's reaction is unpredictable. You need to be prepared for any scenario.
We recommend you to familiarize yourself:
Overview of the EUR/USD pair. November 4. Macroeconomic statistics and Christine Lagarde's speech.
Overview of the GBP/USD pair. November 4. Ahead of the Bank of England meeting.
Forecast and trading signals for EUR/USD for November 4. Detailed analysis of the movement of the pair and trade deals.
COT report
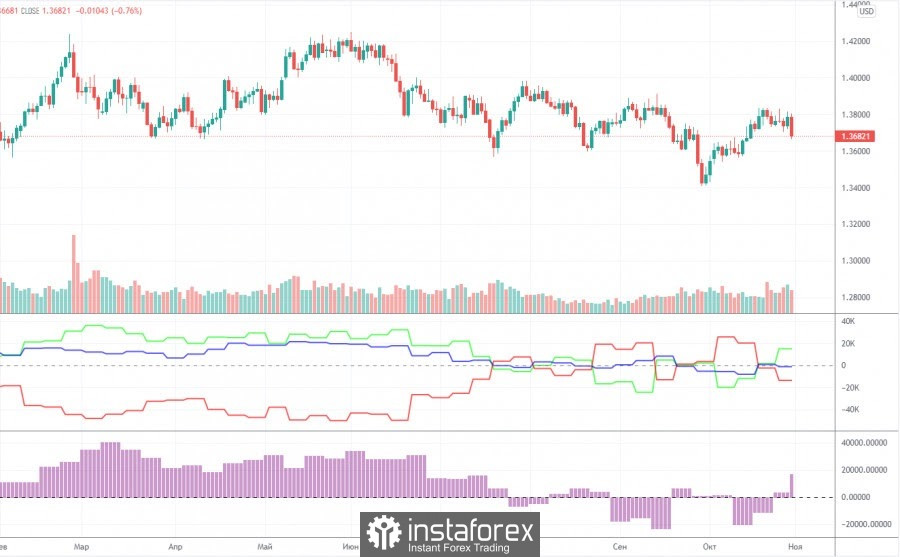
The mood of professional traders became more bullish during the last reporting week (October 19-25). The situation with the COT reports is now even more ambiguous than with the technical picture. And if we compare the COT reports for the euro and the pound, the situation becomes even stranger. Both indicators in the chart above show that the major players still do not have any clear, precise and understandable mood. Consequently, it simply does not make sense to make any forecasts based on COT reports now. The chart above clearly shows the pair's entire movement over the past six months. It is rather difficult to call it a trend or even a trend. The mood of the big players has been constantly changing in the last couple of months. The green and red lines of the first indicator (net positions of groups of traders "commercial" and "non-commercial") are constantly changing the direction of movement, constantly crossing the zero mark. This means that the two largest groups of traders are constantly increasing and decreasing their net positions. During the reporting week, professional traders opened 2.8 thousand buy contracts (longs) and closed 10.7 thousand sell contracts (shorts). Thus, their net position increased by 10,000 contracts. This is in line with what has been happening with the pound in recent weeks (it is growing). Nevertheless, it is impossible to make a long-term forecast, since the net position may fall already by the end of next week. Especially considering the fall of the pound itself on Friday.
Explanations for the chart:
Support and Resistance Levels are the levels that serve as targets when buying or selling the pair. You can place Take Profit near these levels.
Kijun-sen and Senkou Span B lines are lines of the Ichimoku indicator transferred to the hourly timeframe from the 4-hour one.
Support and resistance areas are areas from which the price has repeatedly rebounded off.
Yellow lines are trend lines, trend channels and any other technical patterns.
Indicator 1 on the COT charts is the size of the net position of each category of traders.
Indicator 2 on the COT charts is the size of the net position for the non-commercial group.


