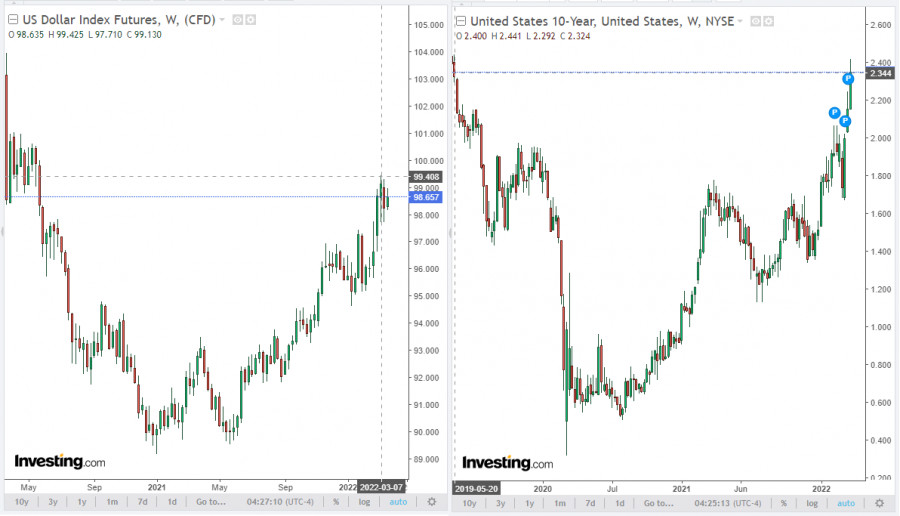
The dollar seems to end this week in positive territory despite the decline during the Asian session. Futures for the dollar index (DXY) are trading near 98.66 at the beginning of today's European session, corresponding to levels of almost 2 years ago. The dollar, in particular, is supported by the rising yields of U.S. government bonds. Thus, the yield on 10-year U.S. bonds reached 2.417% this week, continuing to grow since August 2020.
The current levels correspond to the levels of May 2019, when the Fed's interest rate was at 2.50%. On the one hand, investors are actively withdrawing from protective government bonds, preferring the dollar. And on the other hand, we can say that market participants are already taking into account the increase in the Fed's interest rates in prices. As is known (in normal economic conditions), an increase in the interest rate and a tightening of the monetary policy of the central bank contributes to the strengthening of the national currency.
During his speeches this week, Fed Chairman Jerome Powell confirmed the possibility of a one-time increase in interest rates by 50 basis points at once. In total, Fed officials are planning 6 more interest rate hikes this year. Thus, by the end of the year, the Fed's interest rate should be at least 2% or more, if it is raised at Fed meetings not by 0.25%, but by 50%.
As for gold, it should be noted that it does not bring investment income, but is in active demand in conditions of economic and geopolitical uncertainty. It is also in demand as a protective asset in the face of rising inflation, and its quotes are extremely sensitive to changes in the policy of the world's largest central banks, primarily the Fed. When their interest rates increase, gold quotes usually decrease.
Nevertheless, at the moment we are seeing an interesting picture.
Despite the fact that the Fed has begun to tighten its monetary policy, and some other major world central banks have signaled their readiness to follow this course as well, gold quotes are not declining, and this month reached an almost 2-year high of $2,070.00 per troy ounce. Recall that the record closing high was reached on August 6, 2020, at $2,069.00.
There are several reasons for the growth of gold quotes. One of the main ones is the geopolitical tension in the world and the situation in Ukraine, where Russia is conducting a military special operation, and on the other hand, it is accelerating inflation in the world.
As follows from the data published on March 10, the consumer price index (CPI) in the United States in February increased by 7.9% (against 7.5% in January) compared to the same period of the previous year, reaching the highest level in 40 years.
In Europe, inflation, which was 5.8% in February, almost three times higher than the ECB's 2% target, is also accelerating rapidly, while the European Central Bank is in no hurry to take measures to contain it, fearing to damage the European economy. Tensions in Ukraine represent a stagflationary shock for Europe, economists say. It increases the risks of a new recession due to restrictions on European exports, problems in supply chains, and rising costs of energy, raw materials for households, and the large industrial sector of the region.
Geopolitical tensions remain, taking into account also economic sanctions against Russia. The situation on the raw materials markets remains difficult, since the Russian Federation is one of the largest suppliers of oil and other energy carriers to the European markets. It is obvious that this tension will further inflate inflation, primarily in Europe. However, restrictive measures on Russian energy carriers, primarily oil, create problems for the United States, where the price of gasoline in a number of U.S. states has passed the $6 per gallon mark and is likely to continue to rise, according to economists, further accelerating inflation.
Thus, despite the Fed's plans to further tighten monetary policy, there are no strong reasons for a decline in the price of gold. On the contrary, many economists expect its growth to resume, especially if it becomes obvious that the Fed is unable to cope with rising inflation. It seems that investors perceive investments in the precious metal as a hedging and value preservation tool, rather than as a speculative position.
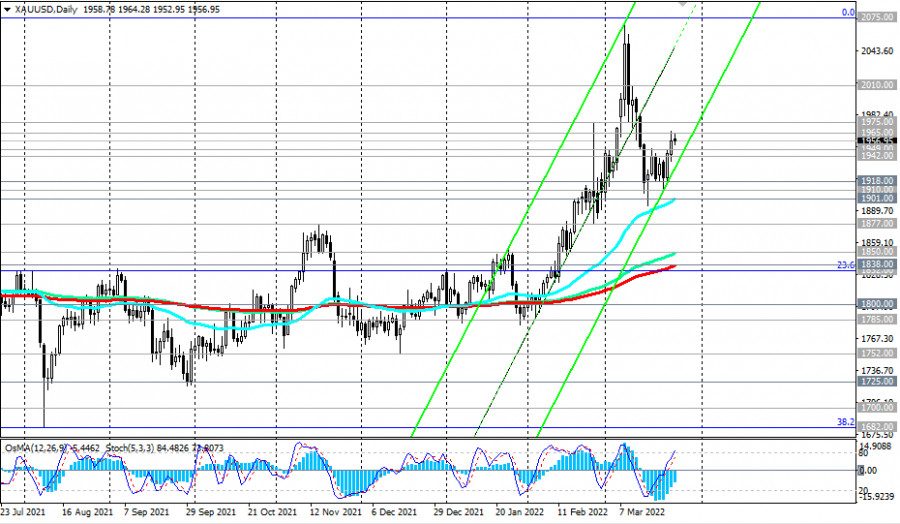
One way or another, gold quotes are finishing this week in positive territory with an increase of about 1.5%, near the mark of $1,957.00 per ounce, despite the growth in yields of U.S. government bonds and the dollar. In the current situation, it will be considered expedient to look for opportunities for the best entry into long positions. One of them, in our opinion, will be a decline to the levels of 1,949.00, 1,942.00 and a breakdown of the level of 1,965.00.
Technical analysis and trading recommendations
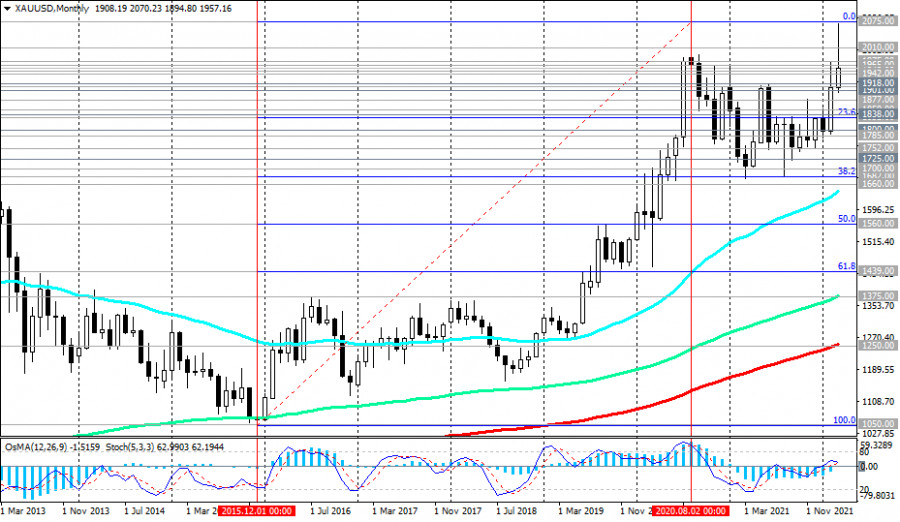
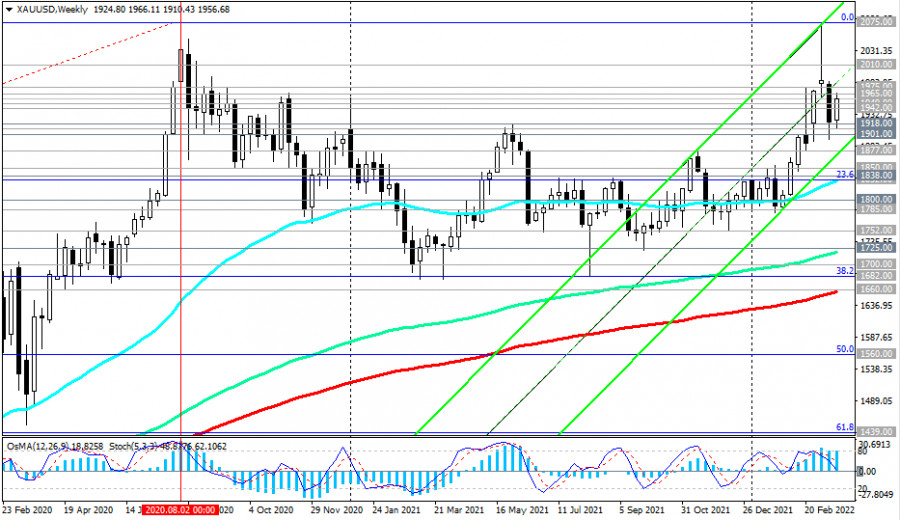
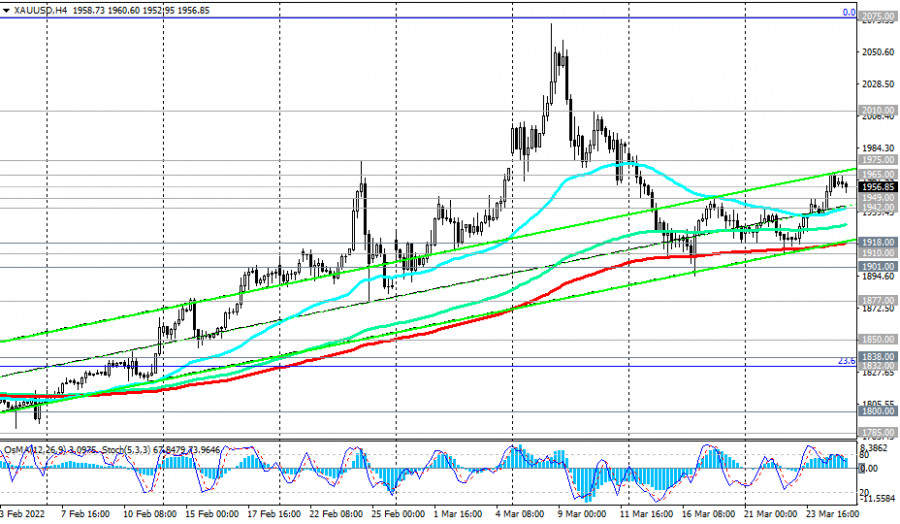
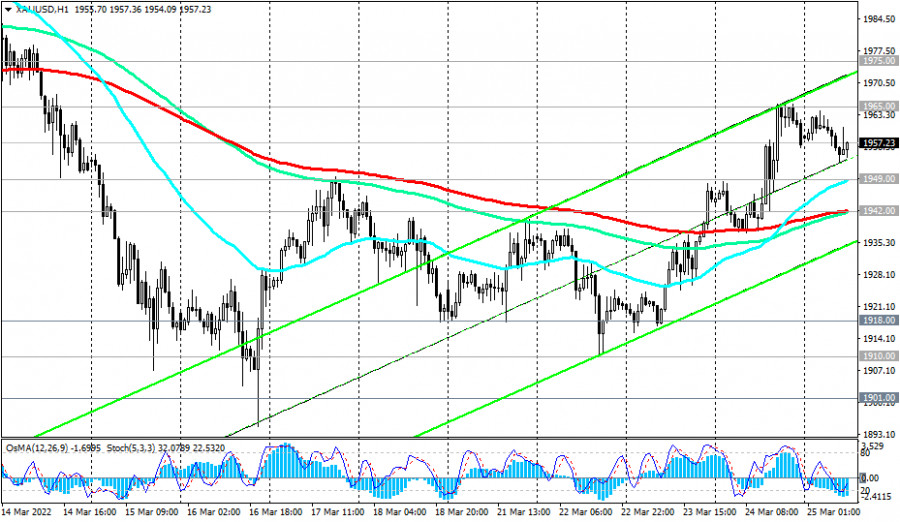
At the time of writing this article, the XAU/USD pair is trading near the 1,957.00 mark, remaining in the bull market zone. A strong upward momentum prevails. In the current situation, long positions look preferable.
A signal to enter them may be a breakdown of the local resistance level of 1,965.00. However, the decline to short-term support levels of 1,949.00 (200 EMA on the 15-minute chart), 1942.00 (200 EMA on the 1-hour chart, and the lower line of the ascending channel on the daily chart) provides additional opportunities to increase long positions.
In an alternative scenario, the price will break through the support level of 1,942.00. In this case, the correction may continue to the support levels of 1,918.00 (200 EMA on the 4-hour chart), 1,910.00 (local lows), 1,901.00 (50 EMA on the daily chart). This decrease can probably also be used to increase long positions (near the support levels of 1,918.00, 1,910.00, 1,901.00).
Above the key support level of 1,838.00 (200 EMA on the daily chart), XAU/USD remains in the long-term bull market zone. Only a breakdown of the support levels of 1,682.00 (38.2% Fibonacci level retracement to the growth wave since December 2015 and the mark of 1,050.00), 1,660.00 (200 EMA on the weekly chart) will increase the risks of breaking the long-term bullish trend of XAU/USD.
Support levels: 1949.00 1942.00 1918.00 1910.00 1901.00 1877.00 1850.00 1838.00 1832.00 1800.00 1785.00 1752.00
Resistance levels: 1965.00, 1975.00, 2000.00, 2010.00, 2070.00, 2075.00
Trading recommendations
XAU/USD: Sell Stop 1935.00. Stop-Loss 1966.00. Take-Profit 1918.00, 1910.00, 1901.00, 1877.00, 1850.00, 1838.00, 1832.00, 1800.00, 1785.00, 1752.00, 1725.00, 1700.00, 1682.00, 1660.00
Buy Limit 1950.00, 1945.00, Buy Stop 1966.00. Stop-Loss 1935.00. Take-Profit 1975.00, 2000.00, 2010.00, 2070.00, 2075.00, 2100.00, 2200.00


