empty
 
 
28.10.2022 06:39 AM
Outlook and trading signals for GBP/USD on October 28. COT report. Analysis of market situation. USD inches up amid strong US GDP data

Analysis of GBP/USD, 5-minute chart

This image is no longer relevant

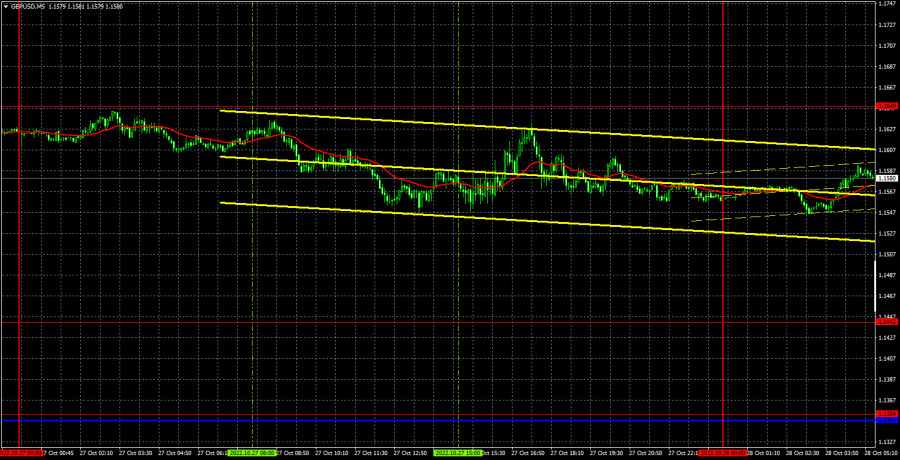
On Thursday, the pound/dollar pair launched its correctional movement. However, it is still above the Ichimoku line. That is why the uptrend is unlikely to stop. Yesterday, traders have great opportunities to sell off the pound sterling since they priced in the ECB's meeting results long ago and the US data was not strong enough. However, yesterday, the market volatility dropped to the lowest level of the week, allowing the pound sterling just to inch down. That is why today or next week, the pair may resume rising. Notably, on Wednesday and Thursday, the BoE and the Fed will hold their meetings that will affect the market situation. Both central banks are planning to raise the key interest rate by 0.75%. The BoE may raise the benchmark rate even more. That is why it is impossible to predict traders' reaction. Yesterday, the situation with the trading signals was quite clear. Since volatility slumped and during the whole day, the pair was trading sideways, the price did not hit any of the expected levels. As a result, traders did not receive any trading signal and failed to enter the market.

COT report

This image is no longer relevant

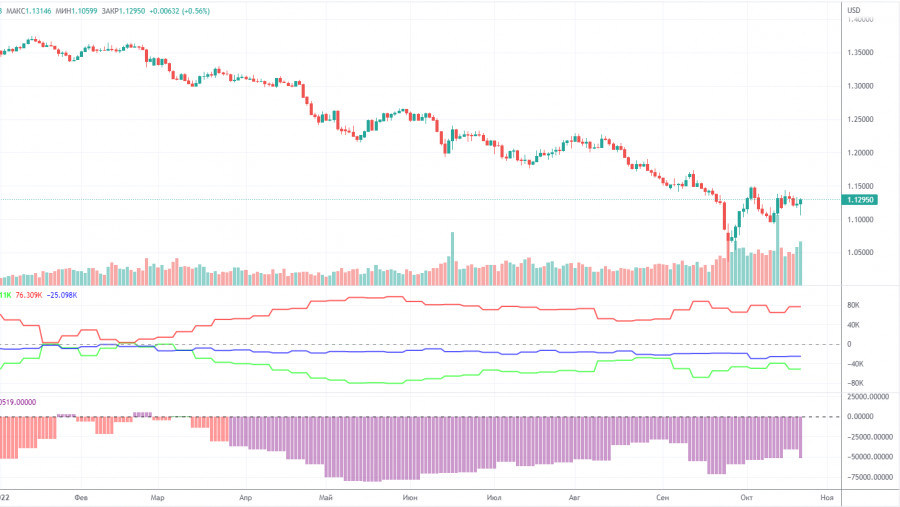
The recent COT report on the pound sterling unveiled that bearish sentiment became stronger. During the week, non-commercial traders closed 8.6 thousand buy orders and opened 3.4 thousand sell orders. Thus, the net position of non-commercial traders dropped by 12.9 thousand. This is a significant decline for the pound sterling. In the last several weeks, the net position was rising. However, it is not the first time when the net position is increasing, whereas the pound sterling continues falling in the short term. Judging by the euro's dynamic, there is great doubt that the British pound will rise. The fact is that traders are mostly buying the US dollar instead of the pound. At the moment, non-commercial traders are keeping open 91 thousand sell orders and 40 thousand buy orders. The difference is considerable. The euro cannot increase even amid bullish sentiment. That is why the pound sterling will neither gain in value due to the bearish sentiment. The number of buy orders exceeds the number of sell orders by 25 thousand. However, this indicator neither reflects the real state of affairs. We are still skeptical about the pound's long-term appreciation. However, there are some technical signs of it.

Analysis of GBP/USD, 1-hour chart

This image is no longer relevant

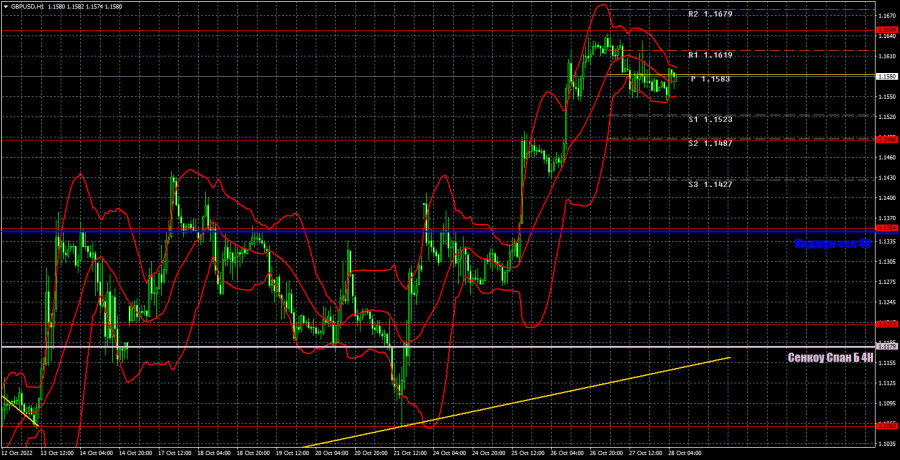
On the one-hour chart, the pound/dollar pair continues following the uptrend. This, in turn, is causing a lot of questions. Why the pound sterling has been rising amid the absence of macroeconomic and fundamental reasons? We suppose that the currency is accelerating ahead of a new slump. On October 28, there are the following important levels: 1.1212, 1.1354, 1.1486, 1.1649, 1.1760, 1.1874. The Senkou Span B (1.1179) and Kijun-sen (1.1352) lines can also give signals if the price rebounds or breaks these levels. The lines of the Ichimoku indicator may move during the day, which should be taken into account when determining trading signals. Also, there are support and resistance levels that can be used to lock in profits. No important events or publications are scheduled for Friday in the UK again. At the same time, the US is going to disclose a few minor reports that are unlikely to interest traders. Therefore, today we will have to trade relying only on technical signals.

What we see on the trading charts:

Price levels of support and resistance are thick red lines, near which the movement may end. They do not provide trading signals.

The Kijun-sen and Senkou Span B lines are the lines of the Ichimoku indicator, moved to the one-hour chart from the 4-hour one. They are strong lines.

Extreme levels are thin red lines from which the price bounced earlier. They provide trading signals.

Yellow lines are trend lines, trend channels, and any other technical patterns.

Indicator 1 on the COT charts reflects the net position size of each category of traders.

Indicator 2 on the COT charts reflects the net position size for the non-commercial group.

Jana pendapatan melalui perubahan kadar mata wang kripto dengan InstaForex.
Muat turun MetaTrader 4 dan buka dagangan pertama anda.
  • Grand Choice
    Contest by
    InstaForex
    InstaForex always strives to help you
    fulfill your biggest dreams.
    SERTAI PERADUAN
  • Chancy Deposit
    Deposit akaun anda sebanyak $3,000 dan dapatkan $5000 lebih lagi!
    Dalam November kami membuat cabutan bertuah $5000 dalam Kempen Chancy Deposit!
    Dapatkan peluang untuk menang dengan membuat deposit $ 3000 ke dalam akaun dagangan. Setelah memenuhi syarat ini, anda menjadi peserta kempen.
    SERTAI PERADUAN
  • Trade Wise, Win Device
    Daftar untuk peraduan dan tambah dana akaun anda dengan sekurang-kurangnya AS$ 500 untuk layak memenangi peranti mudah alih.
    SERTAI PERADUAN
  • Bonus 100%
    Peluang istimewa anda untuk menerima bonus 100% pada deposit anda
    DAPATKAN BONUS
  • Bonus 55%
    Dapatkan bonus 55% pada setiap deposit anda
    DAPATKAN BONUS
  • Bonus 30%
    Dapatkan bonus 30% setiap kali anda membuat penambahan dana akaun anda
    DAPATKAN BONUS

Artikel yang dicadangkan

Tidak boleh bertanya sekarang?
Tanya soalan anda di Ruangan bersembang.
Panggilan semula Widget