empty
21.12.2022 11:27 AM
EUR/USD, GBP/USD: trading plan for beginners on December 21, 2022

Macroeconomic calendar on December 20

Tuesday's macroeconomic calendar was not much different from Monday's one. It was bereft of any important releases from Europe and the UK. Meanwhile, the United States published data on the housing market, which reflected big problems in this sector of the economy.

US building permits fell by 11.2% in November, notching the biggest decline since the beginning of the year. At the same time, housing starts decreased by 0.5% in November.

As a result, the US dollar slowed down its upward cycle.

Overview of trading charts on December 20

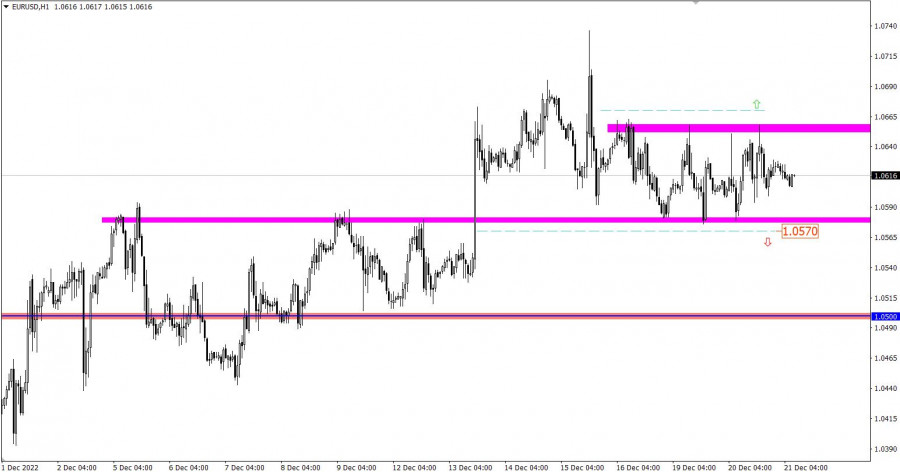
The EUR/USD pair has been moving within the sideways range of 1.0580/1.0660 for the third consecutive day, which indicates an accumulation process. Most likely, the current stagnation will trigger fresh momentum in the market.

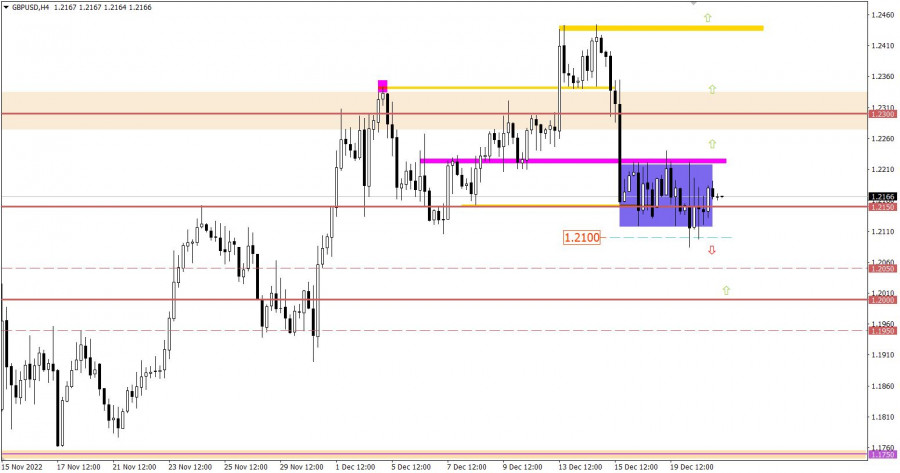
Meanwhile, the GBP/USD pair is also trading sideways around the level of 1.2150. Notably, there are many Doji candles on the four-hour chart, which indicates clear uncertainty over its further movement among market participants. At the same time, this movement can be classified as an accumulation process, which may force the price to gain strong momentum and get out of the range.

This image is no longer relevant

Macroeconomic calendar on December 21

For the third day in a row, the macroeconomic calendar has been almost bereft of any important releases.

The only thing traders may take notice of is US existing home sales, which are forecast to have declined in November.

Time targeting

US Existing Home Sales (Nov)

EUR/USD trading plan for December 21

Based on the successive cycles in the given range, it can be assumed that the price may gain momentum and get out of the range. The best tactic is to trade with a view to breaking through one or another range boundary, waiting for confirmation on the four-hour chart.

Conclusion:

A bullish scenario will be considered by traders if the price consolidates above 1.0670 on the four-hour chart. In this case, the volume of long positions will increase, and the price may rise above the local high of the upward cycle.

A bearish scenario will be relevant if the price fixes below 1.0570 on the four-hour chart. In this case, the price is expected to return to the area of 1.0500.

This image is no longer relevant

GBP/USD trading plan for December 21

The sideways range is limited by the levels of 1.2100 and 1.2230. To get out of the range, the quote needs to break through one or another range boundary on the four-hour chart. In this case, there will be an increase in the volume of trading positions in the direction of a breakout.

Conclusion:

A bullish scenario will be considered by traders if the price consolidates above 1.2230 on the four-hour chart. This move will lead to an increase in the volume of long positions, and the pair will head towards 1.2300-1.2350.

A bearish scenario will be relevant if the price fixes below 1.2100 on the four-hour chart. In this case, the price is expected to return to the psychological level of 1.2000.

This image is no longer relevant

What's on trading charts

The candlestick chart shows graphical white and black rectangles with lines from above and below. While conducting a detailed analysis of each individual candlestick, one can notice its features intrinsic to a particular time frame: the opening price, the closing price, as well as the highest and lowest prices.

Horizontal levels are price levels, at which the price may stop or reverse. They are called support and resistance levels.

Circles and rectangles are highlighted examples where the price reversed in the course of its history. This color highlighting indicates horizontal lines, which can exert pressure on the quote in the future.

Up/down arrows signal a possible future price direction.

Traders are recommended to read the following article:

EUR/USD and GBP/USD: trading plan for beginners on December 20

Pilih carta masa
5
min
15
min
30
min
1
jam
4
jam
1
hari
1
minggu
Jana pendapatan melalui perubahan kadar mata wang kripto dengan InstaForex.
Muat turun MetaTrader 4 dan buka dagangan pertama anda.
  • Chancy Deposit
    Deposit akaun anda sebanyak $3,000 dan dapatkan $1000 lebih lagi!
    Dalam April kami membuat cabutan bertuah $1000 dalam Kempen Chancy Deposit!
    Dapatkan peluang untuk menang dengan membuat deposit $ 3000 ke dalam akaun dagangan. Setelah memenuhi syarat ini, anda menjadi peserta kempen.
    SERTAI PERADUAN

Artikel yang dicadangkan

Bagaimana Berdagang Pasangan GBP/USD pada 11 April? Tip Ringkas dan Analisis Dagangan untuk Pedagang Baharu

Dalam tempoh 24 jam yang lalu, pasangan GBP/USD telah meningkat sebanyak 170 pips. Pada malam menuju hari Jumaat, pound sterling terus meningkat. Beberapa hari lalu, kami menyatakan bahawa dolar telah

Paolo Greco 06:04 2025-04-11 UTC+2

Bagaimana untuk Berdagang Pasangan EUR/USD pada 11 April? Petua Ringkas dan Analisis Dagangan kepada Pedagang Baharu

Analisis Dagangan Hari Khamis Carta 1 Jam bagi pasangan EUR/USD Pada hari Khamis, pasangan mata wang EUR/USD menyambung semula pergerakan naiknya dan mencatatkan peningkatan lebih daripada 300 pip. Apabila hari

Paolo Greco 06:04 2025-04-11 UTC+2

Cadangan Dagangan dan Analisis untuk EUR/USD pada 11 April: Trump Sekali Lagi Menaikkan Tarif terhadap China

Analisis 5 Minit pasangan EUR/USD Pasangan mata wang EUR/USD mencatatkan lonjakan yang sangat kuat pada hari Khamis — satu pergerakan yang, pada ketika ini, mungkin tidak lagi mengejutkan sesiapa. Sejurus

Paolo Greco 03:28 2025-04-11 UTC+2

GBP/USD: Rancangan Dagangan untuk Sesi AS pada 10 April (Tinjauan Dagangan Pagi)

Dalam ramalan pagi saya, saya menekankan tahap 1.2871 dan merancang untuk membuat keputusan kemasukan pasaran berdasarkan tahap tersebut. Mari kita lihat carta 5 minit dan lihat apa yang berlaku. Peningkatan

Miroslaw Bawulski 20:11 2025-04-10 UTC+2

EUR/USD: Rancangan Dagangan untuk Sesi Urusniaga Amerika Syarikat pada 10 April (Semakan Dagangan Pagi)

Dalam ramalan pagi, saya menarik perhatian kepada paras 1.1019 dan merancang untuk membuat keputusan kemasukan pasaran berdasarkan paras tersebut. Mari kita lihat carta 5 minit untuk memahami apa yang berlaku

Miroslaw Bawulski 20:08 2025-04-10 UTC+2

Bagaimana Berdagang Pasangan GBP/USD pada 10 April? Tip Ringkas dan Analisis Dagangan untuk Pedagang Baharu

Pada 24 jam yang lalu, pasangan GBP/USD menunjukkan pergerakan menaik dan turun, dan kemudian naik semula. Seperti sebelumnya, adalah sukar untuk mengenal pasti aliran yang jelas pada carta masa satu

Paolo Greco 06:49 2025-04-10 UTC+2

Bagaimana untuk Berdagang Pasangan EUR/USD pada 10 April? Petua Ringkas dan Analisis Dagangan kepada Pedagang Baharu

Analisis Dagangan Hari Rabu Carta 1 Jam pasangan EUR/USD Pasangan mata wang EUR/USD menunjukkan pertumbuhan dan penurunan yang ketara pada hari Rabu. Baru-baru ini, kedua-dua pergerakan tersebut telah dicetuskan oleh

Paolo Greco 06:49 2025-04-10 UTC+2

Cadangan dan Analisis Dagangan untuk GBP/USD pada 10 April: Siapa Peduli Tentang Inflasi AS Sekarang?

Pada hari Rabu, pasangan mata wang GBP/USD menunjukkan pergerakan bercampur sepanjang hari tetapi secara umumnya mengekalkan aliran menurun — jika kita boleh memanggil tingkah laku semasa ini sebagai "aliran." Tiada

Paolo Greco 03:21 2025-04-10 UTC+2

Cadangan Dagangan dan Analisis untuk EUR/USD pada 10 April: Tarif 500% untuk China!

Analisis 5 Minit pasangan EUR/USD Pada hari Rabu, pasangan mata wang EUR/USD bergerak tepat seperti yang dijangkakan — dalam beberapa aspek. Pertama sekali, mari kita mulakan dengan corak "segitiga" yang

Paolo Greco 03:21 2025-04-10 UTC+2

Bagaimana untuk Berdagang Pasangan GBP/USD pada 9 April? Tip Ringkas dan Analisis Dagangan untuk Pedagang Baharu

Pada hari Selasa, pasangan GBP/USD didagangkan dengan sedikit kecenderungan menaik. Tiada peristiwa berita utama sepanjang hari, dan hanya pada waktu petang berita tentang peningkatan tarif ke atas China yang muncul

Paolo Greco 06:47 2025-04-09 UTC+2
Tidak boleh bertanya sekarang?
Tanya soalan anda di Ruangan bersembang.
Panggilan semula Widget
 

Dear visitor,

Your IP address shows that you are currently located in the USA. If you are a resident of the United States, you are prohibited from using the services of InstaFintech Group including online trading, online transfers, deposit/withdrawal of funds, etc.

If you think you are seeing this message by mistake and your location is not the US, kindly proceed to the website. Otherwise, you must leave the website in order to comply with government restrictions.

Why does your IP address show your location as the USA?

  • - you are using a VPN provided by a hosting company based in the United States;
  • - your IP does not have proper WHOIS records;
  • - an error occurred in the WHOIS geolocation database.

Please confirm whether you are a US resident or not by clicking the relevant button below. If you choose the wrong option, being a US resident, you will not be able to open an account with InstaForex anyway.

We are sorry for any inconvenience caused by this message.