On Friday and Monday, the EUR/USD currency pair rose by at least 250 points. The upward trend started on Friday and continued based on the data from Friday, so it makes no sense in principle to take into account the fundamental and macroeconomic events of Monday as they did not occur. So it makes sense to think about Friday. The European Union then released an inflation report for December in the morning. The market had anticipated a significantly smaller decrease in the consumer price index, but it instead slowed to 9.2%. What does this number indicate? First, the EU's inflation has already started to decline, which is excellent. But this is beneficial for the European economy, not the euro. Remember that if inflation falls soon, the ECB will have less incentive to tighten monetary policy aggressively. The moment when the regulator will refuse to raise the rate at all begins to loom on the horizon if the rate starts to increase more slowly. As a result, the value of the local currency starts to decline. For instance, the US dollar experienced this at the start of last autumn. The market started to take profits on dollar positions and refused to buy them as soon as it recognized that after a few more meetings, the rate would start to slow down in its increase and then stop expanding entirely. The US currency has been under market pressure ever since.
A more pronounced decrease in inflation is therefore negative rather than positive for the euro. However, the market paid no attention to this information at all on Friday. Although we are aware that there were other big events scheduled for that day, the inflation data is still not a gauge of business activity. We find it unusual that merchants have chosen to forgo any attempt at resolution. Well, it's often difficult to explain why the value of the euro increased on Monday and in the afternoon. Only the ISM business activity index for the US services sector, which unexpectedly declined at the end of December and surprised many, spoke in favor of the euro. We have stated time and time again that the Markit and ISM indices currently display entirely different values. For a very long time, Markit has remained below the "waterline." The ISM index might be substantially higher than the 50.0 mark at the same time. However, everything came together on Friday. Even though it is obvious to everyone that economic activity is declining in the US, the EU, and the UK right now, it is still unclear why the market responded so aggressively to this index.
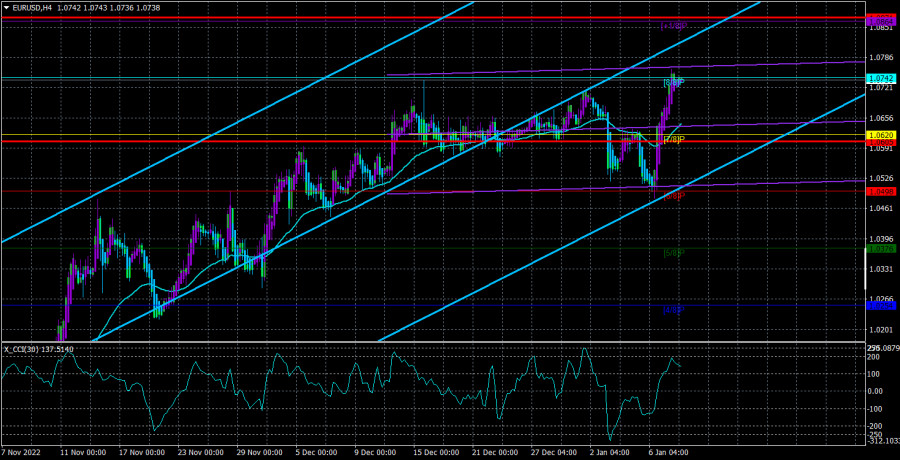
The level of 1.0742 is the only one where the euro can stop growing.
Thus, we have once again seen completely irrational buying of the euro. Here, it should be emphasized once more that the market is made up of a sizable number of traders from all backgrounds. There are significant firms that enter the market purely out of a need for one or more currencies. They don't open positions to make money. The current state of the euro's growth is of no interest to them. They purchase euros if they need them. Perhaps this is the reason why this currency is currently increasing even though the vast majority of indicators point to the dollar strengthening. Unfortunately, there is nothing that can be done. However, we always have a technical image that most accurately captures the state of the market. We frequently state that technical indications must support any basic premise. The hypothesis shouldn't be tested if there are none.
The euro/dollar pair has now returned to the Murray level of "8/8" (1.0742); it is above the moving average, giving us the technical picture seen below. Although we don't think the 1.0742 level will be broken, the market is willing to repurchase the pair, so the upward trend may continue. The price could return to the region below the moving average line and attempt to begin the downward correction that we have been discussing for a month, but there is a definite rebound from this level. Remember that the euro currency grew too quickly and excessively in the last three to four months of last year and is unable to even correct itself after this movement.
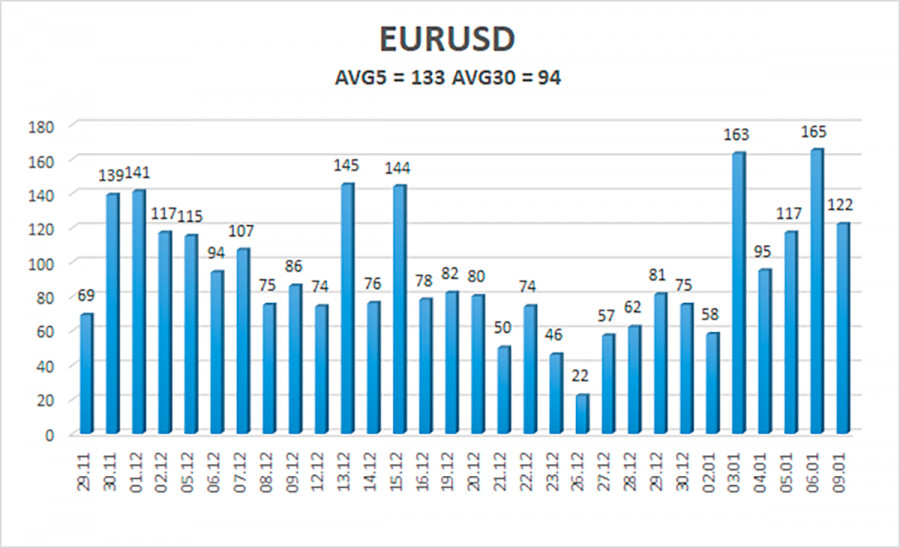
As of January 10, the euro/dollar currency pair's average volatility over the previous five trading days was 133 points, which is considered "high." So, on Tuesday, we anticipate the pair to fluctuate between 1.0605 and 1.0871. A bout of corrective movement will begin when the Heiken Ashi indicator reverses to the downside.
Nearest levels of support
S1 – 1.0620
S2 – 1.0498
S3 – 1.0376
Nearest levels of resistance
R1 – 1.0742
R2 – 1.0864
R3 – 1.0986
Trading Advice:
The EUR/USD pair is attempting to maintain its upward trend. You should continue holding long positions at this time with a target price of 1.0864 until the Heiken Ashi signal turns bearish. After the price is anchored below the moving average, short positions should be initiated with a target of 1.0498.
Explanations for the illustrations:
Determine the present trend with the use of linear regression channels. The trend is now strong if they are both moving in the same direction.
Moving average line (settings 20.0, smoothed): This indicator identifies the current short-term trend and the trading direction.
Murray levels serve as the starting point for adjustments and movements.
Based on current volatility indicators, volatility levels (red lines) represent the expected price channel in which the pair will trade the following day.
A trend reversal in the opposite direction is imminent when the CCI indicator crosses into the overbought (above +250) or oversold (below -250) zones.


