empty
06.02.2023 11:49 AM
EUR/USD and GBP/USD technical analysis on February 6, 2023

EUR/USD

This image is no longer relevant

Higher time frames

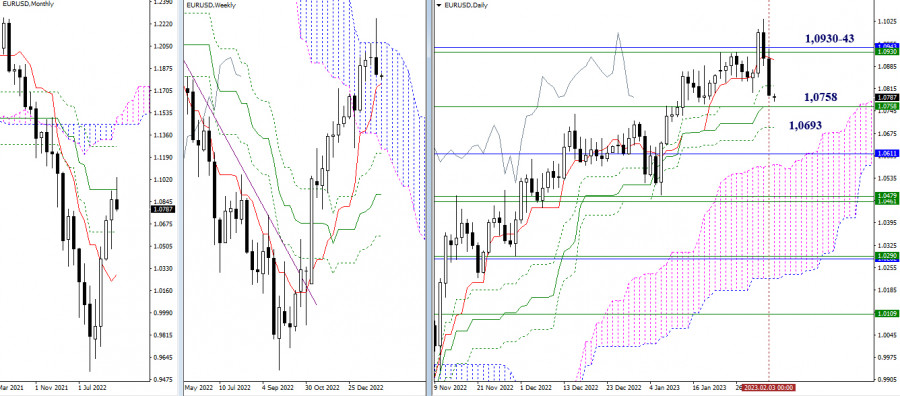
Last week, the pair bounced off the resistance area at 1.0930-43 which coincided with the upper boundary of the weekly Ichimoku Cloud and the monthly medium-term trend. To confirm a rebound and extend it further to the downside, bears need to overcome the support of the weekly short-term trend at 1.0758 and cancel the Golden Cross at 1.0758 – 1.0693.

This image is no longer relevant

H4 – H1

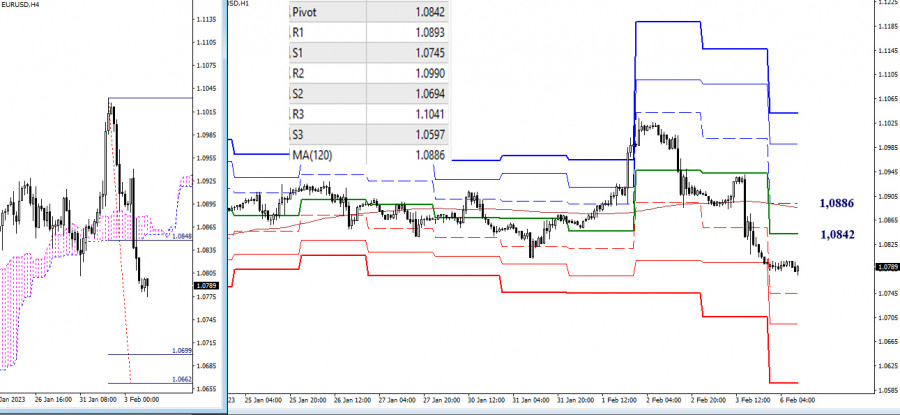
At the moment, bears have seized the initiative on lower time frames. Their downward targets for today are found at the standard pivot levels of 1.0745 – 1.0694 – 1.0597. Another target is the breakout point of the H4 Ichimoku Cloud at 1.0699 – 1.0692. Notably, the support zones on lower time frames are fortified by the support area on longer time periods at 1.0758 – 1.0693. The resistance is now formed by the key levels of the standard pivot point at 1.0842 and the weekly long-term trend at 1.0886. A firm hold above this price range may change the market balance.

***

GBP/USD

This image is no longer relevant

Higher time frames

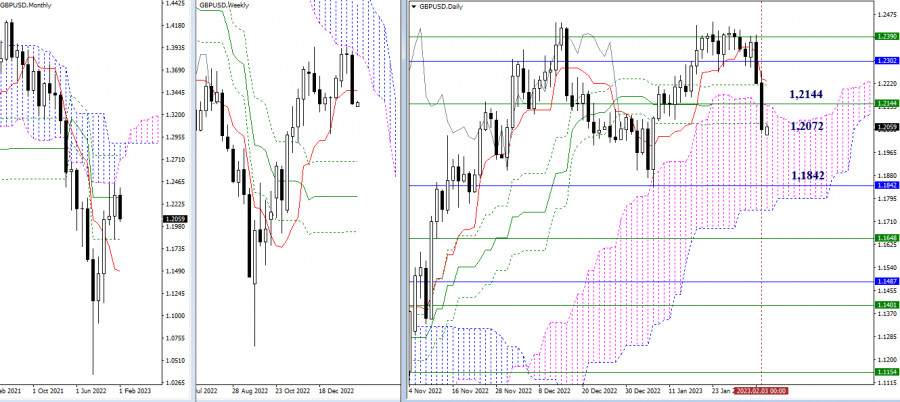
After trading for some time along the resistance level and the lower boundary of the weekly Ichimoku Cloud at 1.2390, the pair came under the control of the sellers. As a result, it closed last week below the key support levels of 1.2144 (weekly short-term trend) and 1.2072 (lower level of the daily Golden Cross). So, bears have entered the daily cloud and are confidently holding there. The levels left behind will now serve as new resistance that will protect the bearish trend. The next downward target is currently seen at the lower boundary of the daily Ichimoku Cloud and the monthly level of 1.1842.

This image is no longer relevant

H4 – H1

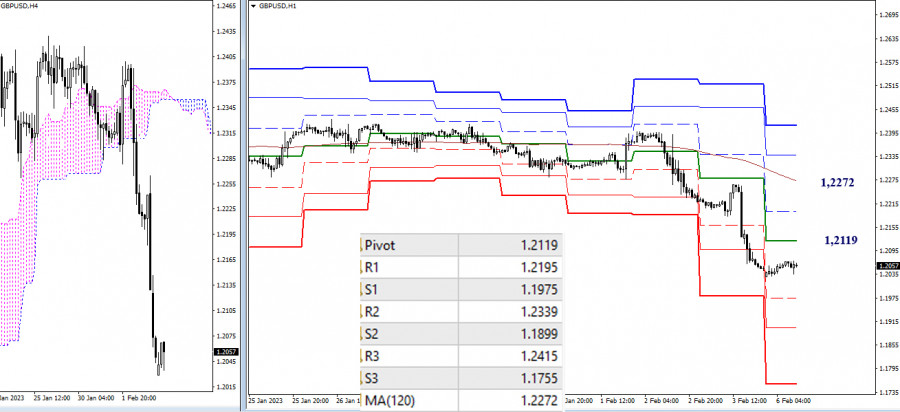
On lower time frames, bears are in control of the market. In the last few hours, the pair has been going through a correction. To deepen its current decline, the pair will need to pass the intraday support formed by the standard pivot levels of 1.1975 – 1.1899 – 1.1755. The key levels of the day are located at 1.2119 (daily central pivot level) and 1.2272 (weekly long-term trend). Consolidation above this range will change the market balance.

***

Technical analysis is based on:

Higher time frames – Ichimoku Kinko Hyo (9.26.52) + Fibo Kijun levels

Lower time frames – H1: Pivot Points (standard) + 120-day Moving Average (weekly long-term trend)

Ringkasan
Segera
Analitic
Zhizhko Nadezhda
Mulakan perdagangan
Jana pendapatan melalui perubahan kadar mata wang kripto dengan InstaForex.
Muat turun MetaTrader 4 dan buka dagangan pertama anda.
  • Grand Choice
    Contest by
    InstaForex
    InstaForex always strives to help you
    fulfill your biggest dreams.
    SERTAI PERADUAN

Artikel yang dicadangkan

Ramalan GBP/USD pada 12 Ogos 2025

Pada carta setiap jam, GBP/USD pada hari Isnin menurun ke kawasan sokongan 1.3416–1.3425 dan kembali arah berhampiran kawasan tersebut yang memihak kepada pound. Ini telah menyambung semula pergerakan menaik

Samir Klishi 11:23 2025-08-12 UTC+2

GBP/USD. Analisis Penunjuk pada 12 Ogos 2025

Pada hari Isnin, pasangan mata wang ini bergerak ke bawah dari EMA 5 hari pada 1.3400 (garis merah tipis) dan kemudian bergerak ke atas, menutup graf lilin harian pada 1.3428

Stefan Doll 10:59 2025-08-12 UTC+2

EUR/USD. Analisis Penunjuk pada 12 Ogos 2025

Pada hari Isnin, pasangan ini bergerak menurun dari paras anjakan semula 50% pada 1.1594 (garis putus-putus kuning), sebelum berbalik meningkat dan menutup dagangan harian pada 1.1614. Hari ini, pergerakan dijangka

Stefan Doll 10:54 2025-08-12 UTC+2

Walaupun kecenderungan Lonnie masih kuat, kemunculan perbezaan pada RSI(14) menunjukkan pembetulan. Selasa, 12 Ogos 2025.

[USD/CAD] – [Selasa, 12 Ogos 2025] Walaupun terdapat penampilan perbezaan antara RSI(14) dan pergerakan harga Lonnie, persilangan emas antara EMA(50) dan EMA(200) menunjukkan pengukuhan yang berterusan. Tahap Utama 1. Rintangan

Arief Makmur 07:52 2025-08-12 UTC+2

Terdapat potensi kelemahan di sebalik dominasi pembeli dalam GBP/USD. Selasa, 12 Ogos 2025.

[GBP/USD] – [Selasa, 12 Ogos 2025] Terdapat potensi untuk pembetulan menurun dalam Cable hari ini, tetapi selagi ia tidak menembusi dan ditutup di bawah 1.3357, kecenderungan kekal kukuh. Paras Utama

Arief Makmur 07:51 2025-08-12 UTC+2

Ramalan EUR/USD untuk 12 Ogos 2025

Dengan sokongan daripada penurunan pasaran saham (S&P 500 –0.25%), euro jatuh sebanyak 25 pip semalam, menembusi di bawah sokongan 1.1632. Jika hari ini ditutup di bawah tahap ini, ia akan

Laurie Bailey 04:53 2025-08-12 UTC+2

Ramalan GBP/USD untuk 12 Ogos 2025

Pound Britain hanya berjaya menembusi paras pertengahan 1.3452 melalui bayang atasnya. Dagangan hari tersebut ditutup dengan kerugian 22 pip. Garis isyarat pengayun Marlin bergerak mendatar di zon positif, maka kami

Laurie Bailey 04:53 2025-08-12 UTC+2

Ramalan USD/JPY untuk 12 Ogos 2025

Semalam, pasangan USD/JPY telah menembusi paras isyarat 148.03 (paras tertinggi 23 Jun). Sesi dagangan hari ini dibuka di atas paras tersebut, dan pada masa yang sama, garis isyarat pengayun Marlin

Laurie Bailey 04:53 2025-08-12 UTC+2

Isyarat Dagangan untuk ETH/USD (Ethereum) bagi 12-15 Ogos 2025: jual di bawah $4,205 (200 EMA - 6/8 Murray)

Pada pasangan ETH/USD, ia sedang diniagakan sekitar 4,237 dalam saluran aliran menaik yang telah terbentuk sejak awal Ogos dan sedang mencapai tahap rintangan sekitar tahap 6/8 Murray. Dalam sesi terbaru

Dimitrios Zappas 04:26 2025-08-12 UTC+2

XAU/USD. Analisis dan Ramalan

Pada hari Isnin, penurunan harian menyebabkan harga emas turun di bawah paras 3365, tetapi penunjuk ayunan pada carta harian masih belum mula mendapat momentum negatif. Ini menunjukkan bahawa logam berharga

Irina Yanina 19:34 2025-08-11 UTC+2
Tidak boleh bertanya sekarang?
Tanya soalan anda di Ruangan bersembang.
Panggilan semula Widget
 

Dear visitor,

Your IP address shows that you are currently located in the USA. If you are a resident of the United States, you are prohibited from using the services of InstaFintech Group including online trading, online transfers, deposit/withdrawal of funds, etc.

If you think you are seeing this message by mistake and your location is not the US, kindly proceed to the website. Otherwise, you must leave the website in order to comply with government restrictions.

Why does your IP address show your location as the USA?

  • - you are using a VPN provided by a hosting company based in the United States;
  • - your IP does not have proper WHOIS records;
  • - an error occurred in the WHOIS geolocation database.

Please confirm whether you are a US resident or not by clicking the relevant button below. If you choose the wrong option, being a US resident, you will not be able to open an account with InstaForex anyway.

We are sorry for any inconvenience caused by this message.