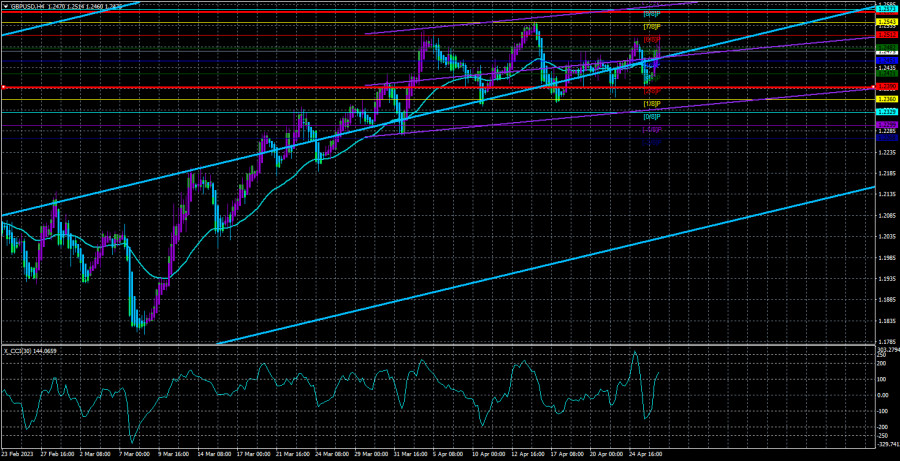
On Wednesday, the GBP/USD currency pair took only a short time to decide which direction to move. The logic was simple: if there was a decline the day before, there should be growth today. Is it worth mentioning that there was no news or report supporting the British pound during the past day? However, the British pound is now trading logically. After all, the pair has been inside a sideways channel for several weeks, which can be seen in the 4-hour timeframe. Thus, within the range of a flat, "up-down" movements are quite logical. Initially (three weeks ago), the movement looked like the final stage of an upward trend, so we didn't immediately conclude that it was a flat and a sideways channel. However, it is now clear that there will be no decline. The pair is again set for a flat and then for a resumption of the upward movement. Therefore, the moving average line has no significance now. The pair crosses it almost every day without any consequences.
Let's note that the GBP/USD pair has also brought the CCI indicator into the overbought area. However, only once, unlike the EUR/USD pair. For a decline in quotes to begin, a minimum of two or three entries into the overbought area is needed. However, we have been talking for several weeks about the pound (and the euro) being too high, growing too illogically, and unjustifiably unable to correct downward. Nothing changes over time; everything remains as it is. Therefore, there is nothing to add regarding the "technique" right now. Trading the pair is still most reasonable on the youngest timeframes; on the older ones, it changes direction daily.
Yesterday, US Treasury Secretary Janet Yellen, who is already associated with us only for news about the US public debt, spoke. Once a year, she makes a sad expression and declares that the country will face an "economic catastrophe" if the government debt limit is not raised. Traders should be reminded that the United States is one of the few countries in the world whose government cannot borrow as much money as it needs at any given time. There is a certain ceiling, which is actually raised every year and currently stands at $31.4 trillion. It can borrow as much money from its central bank (the Fed) as it needs, but Congress must approve this initiative. The funny thing is that the US government borrows most of the loans from itself, i.e., from the Federal Reserve, which is officially not subject to the president, Congress, or anyone else. Each time this story with public debt ends the same way: the limit is raised, and the default is postponed for another year until the money runs out. It will be the same this time.
Nevertheless, Ms. Yellen tried her best to scare the markets yesterday. In particular, she reported that a default would lead to a catastrophe and increase the cost of borrowing many times over an indefinite period. Interest rates would rise for years, unemployment would increase, and all types of loans would become more expensive. She called on Congress to raise the limit; otherwise, the US economic growth achieved after the pandemic would be jeopardized. If the limit is not raised or "frozen," the US government cannot pay pensions, military payments to their families, and other social payments. According to Yellen, Congress should not just make this decision but do so as soon as possible to prevent the suspension of funding for government structures. The curtain could be lowered if the market reacted to Yellen's speech by selling dollars. Nothing is dangerous in this situation, and the debt ceiling will be raised as it has been dozens of times before.

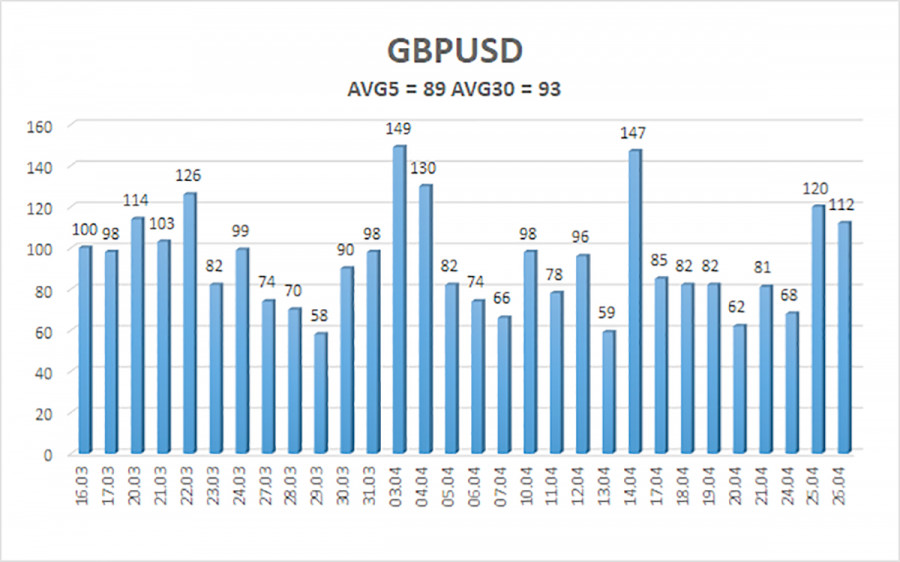
The average GBP/USD pair volatility for the last five trading days is 89 points. For the pound/dollar pair, this value is "average." On Thursday, April 27th, we thus expect movement within the channel limited by levels 1.2390 and 1.2567. A downward reversal of the Heiken Ashi indicator will signal a new downward wave within the sideways channel.
Nearest support levels:
S1 – 1.2451
S2 – 1.2421
S3 – 1.2390
Nearest resistance levels:
R1 – 1.2482
R2 – 1.2512
R3 – 1.2543
Trading recommendations:
The GBP/USD pair trades around the moving average line in a flat on the 4-hour timeframe. At this time, you can trade only by the reversals of the Heiken Ashi indicator or on younger timeframes, as there is no clear trend – the price is too close to the moving average and ignores it.
Explanations for the illustrations:
Linear regression channels – help determine the current trend. If both point in the same direction, the trend is currently strong.
Moving average line (settings 20.0, smoothed) – determines the short-term trend and the direction in which trading should be conducted now.
Murray levels – target levels for movements and corrections.
Volatility levels (red lines) – the likely price channel the pair will spend the next day, based on current volatility indicators.
CCI indicator – its entry into the oversold area (below -250) or the overbought area (above +250) means that a trend reversal is approaching in the opposite direction.


