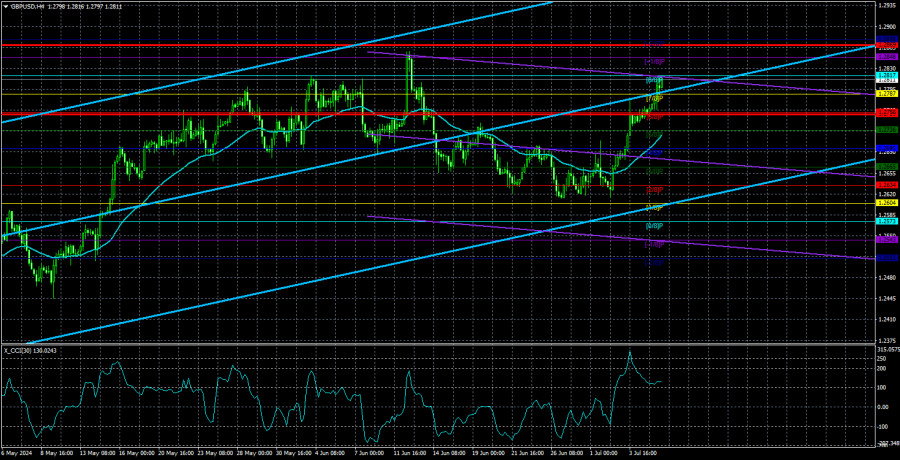
GBP/USD continued to show a bullish bias and is now very close to its last local high. We would like to say that it was illogical for the pound to show growth last week, but we must acknowledge the fact that almost all of the US economic reports were weak. Friday was merely the final note in the overture of the dollar's decline. The NonFarm Payrolls data was disappointing, but only relative to market expectations. The rise in unemployment was expected, given the Federal Reserve's prolonged adherence to hawkish policies. The number of NonFarm Payrolls in June was 206,000. Can anyone say that's not enough? The May figure was revised downward from 272,000 to 218,000, but can anyone say that's not enough? Thus, both the weak data from the US and the market's consistently high expectations played a cruel joke on the dollar again.
We would like to point out that, in this way, the pound can continue to rise indefinitely. If the market sets high expectations for every subsequent report, the actual value will never exceed the forecast. And as a result, the dollar will always have a reason to fall. We still believe that the US economy is in very good shape, as Fed representatives constantly mention. And it is undoubtedly true that the state of the US economy is better than that of the UK. But in recent months, everything has been working against the dollar.
This week, the UK will release monthly and quarterly GDP data, as well as industrial production data. In both cases, minimal growth is expected, which will be very easy to exceed, giving the pound new reasons to rise. If the forecasts for US data are high, then they are underestimated for the UK.
On the US data front, inflation data for June, the producer price index, and the consumer sentiment index will be released. The inflation forecast is at 3.4%, the same as the previous month. Now let's imagine that inflation decreases by 0.1% for the third consecutive month. Once again this will be a reason to get rid of the dollar, as the market will conclude that the Fed is approaching the moment of the first easing of monetary policy. And it doesn't matter that inflation in America is currently higher than last summer, so what slowdown can we even talk about? It doesn't matter that inflation in the US seems to be more of a pretense of decreasing rather than actually decreasing. It doesn't matter that inflation in the UK is at 2%, which allows the Bank of England to start lowering rates at the next meeting. A 3.3% figure in June could once again put the dollar in a slump.
In addition, Fed Chair Jerome Powell will deliver two speeches this week. He will likely remain hawkish, but does it even matter? Powell spoke last week and the dollar kept falling and continues to do so.
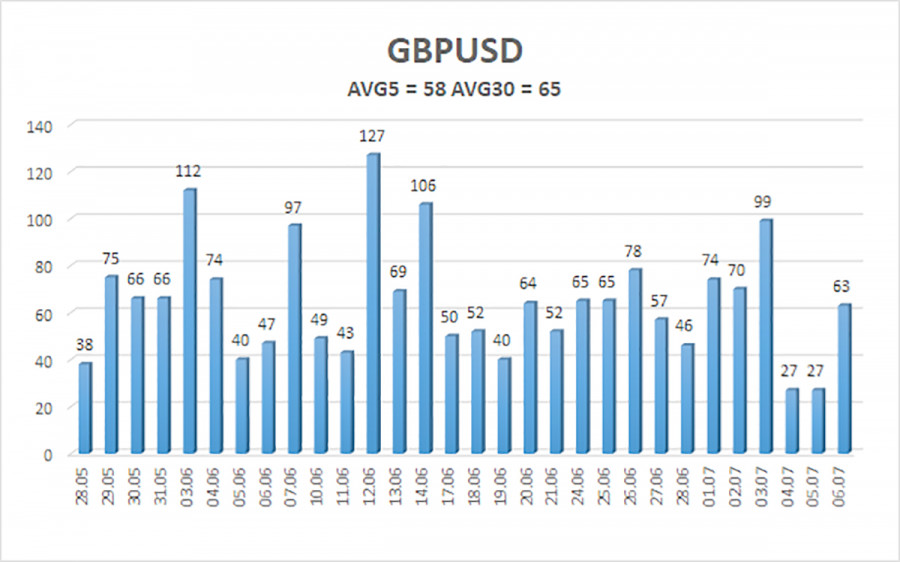
The average volatility of GBP/USD over the last five trading days is 58 pips. This is considered an average value for the pair. Today, we expect GBP/USD to move within a range bounded by the levels of 1.2753 and 1.2869. The higher linear regression channel is pointing upwards, which suggests that the upward trend will continue. Last week, the CCI indicator entered the overbought area and drew divergence from the last two highs.
Nearest support levels:
S1 - 1.2787
S2 - 1.2756
S3 - 1.2726
Nearest resistance levels:
R1 - 1.2817
R2 - 1.2848
R3 - 1.2878
Trading Recommendations:
The GBP/USD pair continues to rise, ignoring all factors in favor of the dollar. Although the US released quite a number of disappointing data last week, we believe that this isn't enough for the pound to sustain its growth. We don't see how the pound would be able to rise above the level of 1.2817. Yes, a new batch of weak (relative to overestimated forecasts) US data may exert a significant amount of pressure on the dollar once again, and in addition to that the market no longer puts a lot of importance on the fundamental background, the policy of the Fed and the Bank of England. Therefore, we cannot say that long positions are the obvious choice at this time. However, the best option now is to trade based on the technical picture.
Explanation of Illustrations:
- Linear Regression Channels – Helps determine the current trend. If both are directed in the same direction, it means the trend is currently strong.
- Moving Average Line (settings 20.0, smoothed) – Determines the short-term trend and the direction in which trading should currently be conducted.
- Murray Levels – Target levels for movements and corrections.
- Volatility Levels (red lines) – The probable price channel in which the pair will spend the next day, based on current volatility indicators.
- CCI Indicator – Its entry into the oversold area (below -250) or the overbought area (above +250) means that a trend reversal in the opposite direction is imminent.


