GBP/USD
Analysis:
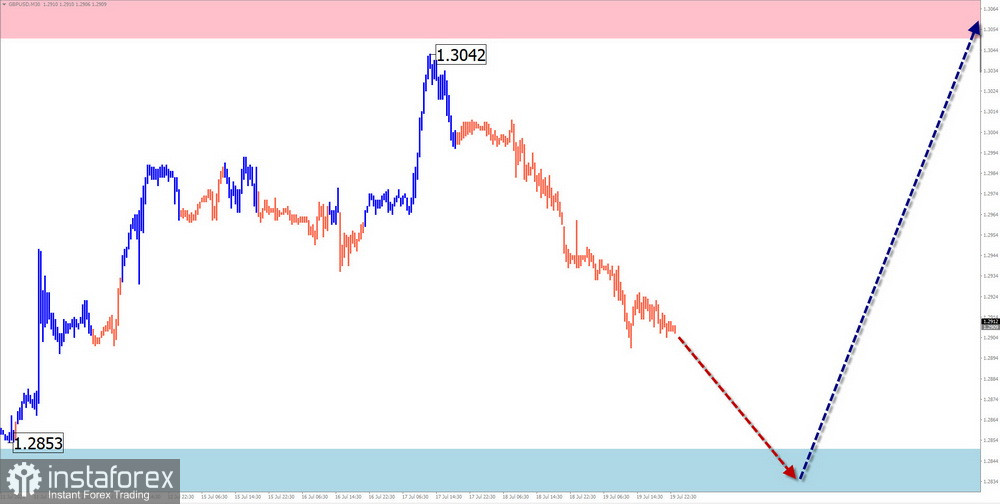
The British pound continues its movement northward on the price chart. A week ago, the pair's prices bounced down from the lower boundary of the powerful potential reversal zone on the weekly time frame, forming a correction. The current wave level of this movement suggests the development of a full-fledged correction.
Forecast:
In the upcoming week, a generally flat trend within the channel between the nearest opposing zones is expected. In the early days, a downward vector is more likely. Further, a reversal and a change in the overall direction can be expected in the area of the calculated support zone, with the resumption of growth towards the resistance zone.
Potential Reversal Zones:
Resistance:
Support:
Recommendations:
Purchases: Risky, but possible within individual sessions with a reduced volume.
Sales: Will become preferable after confirmed signals appear in the area of the calculated resistance.
AUD/USD
Analysis:
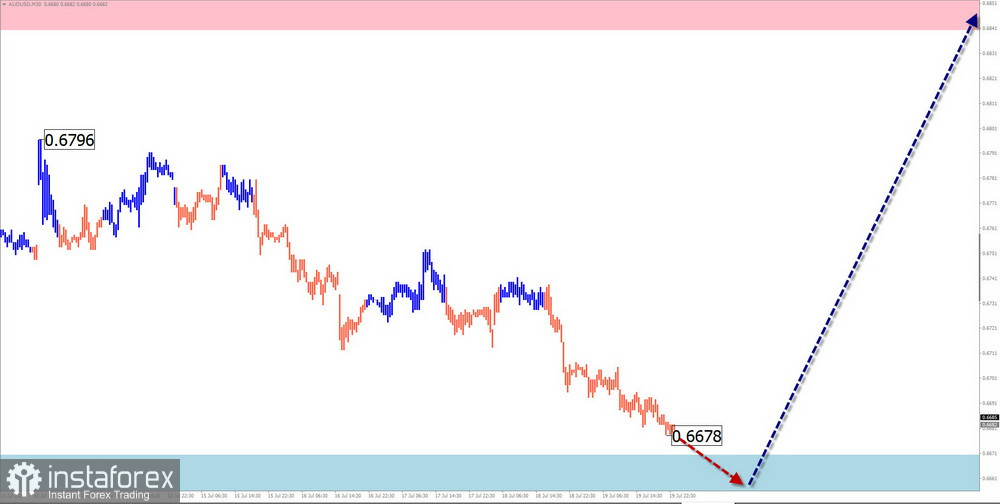
A horizontal corrective wave has been forming on the Australian dollar chart since July last year. The wave's extremes form a pennant. The price mostly moves along the lower boundary of the reversal zone of the large time frame. The bearish section that started two weeks ago is nearing completion.
Forecast:
A sideways movement vector is expected at the beginning of the upcoming week, with a decline to the support boundaries. After that, a reversal and resumption of the upward price movement can be expected. When the course changes, a sharp increase in volatility, with a brief break below the lower boundary of the calculated support, is not excluded.
Potential Reversal Zones:
Resistance:
Support:
Recommendations:
Sales: Have no potential.
Purchases: Will become relevant after reversal signals are formed in the support area.
USD/CHF
Analysis:
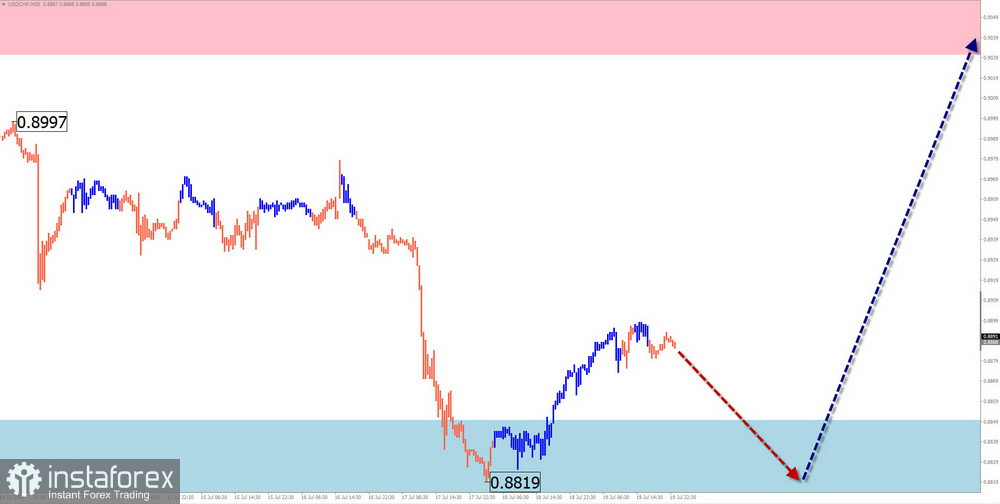
A downward wave has been forming on the Swiss franc chart since early May. The analysis of its structure shows its incompleteness. This section corrects a larger upward wave model. The price has reached the upper boundary of strong support.
Forecast:
The general sideways price movement vector will continue in the upcoming week. Brief pressure on the support zone in the early days is possible. A resumption of price growth is likely closer to the weekend. A rise in prices above the calculated resistance boundaries within the upcoming week is unlikely.
Potential Reversal Zones:
Resistance:
Support:
Recommendations:
Purchases: Risky. They can be used only within intraday trading with a fractional volume.
Sales: May become the main direction for trades after your trading system confirms signals at the ends of opposing movements.
EUR/JPY
Analysis:
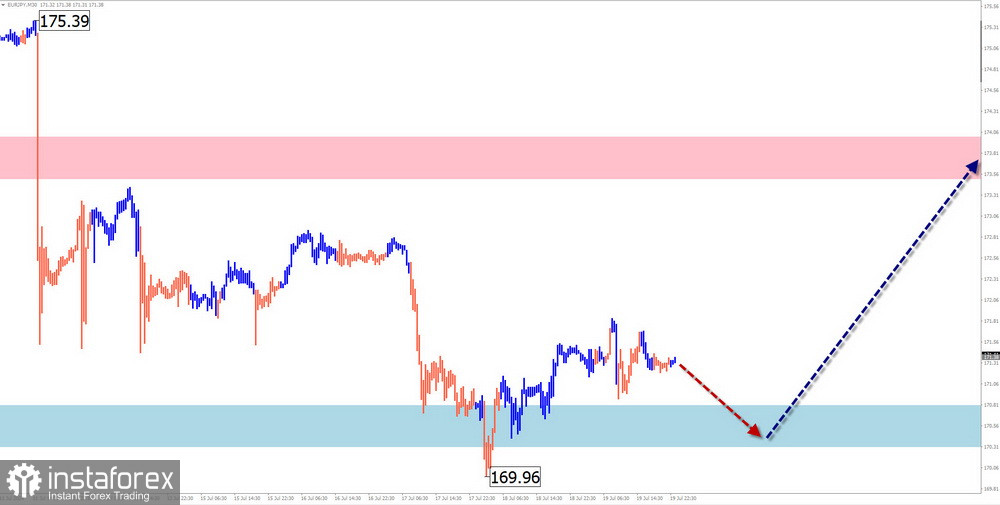
In the short term, the bullish wave model of the euro/yen pair from May 3rd needs to be completed. In the last two weeks, the price has been correcting downward. The structure of this wave has entered its final phase. The price has approached the support level of the daily time frame.
Forecast:
The first half of the upcoming week is expected to see a downward price movement. In the area of the calculated support, a transition to a sideways plane and a reversal can be expected. A resumption of price growth is likely by the end of the week or in the following days.
Potential Reversal Zones:
Resistance:
Support:
Recommendations:
Sales: Highly risky. Using a conservative approach, it is better to refrain from entering the market.
Purchases: Can be used in trades after confirmed signals appear in the support area.
AUD/JPY
Analysis:
In the short term, the direction of movement of the Australian dollar/Japanese yen pair has been set by an upward wave algorithm since early December last year. Since mid-last month, the price has been corrected sideways. The structure of this wave does not show completion.
Forecast:
The pair's general sideways movement vector at the beginning of the upcoming week is highly likely. A decline in the calculated support area is possible. Price growth can be expected to resume closer to the weekend. The calculated resistance runs along the lower boundary of the preliminary target zone of the entire current wave.
Potential Reversal Zones:
Resistance:
Support:
Recommendations:
Sales: Possible only within intraday trading with a small volume. The potential is limited by support.
Purchases: After confirmed reversal signals appear in the support area, they can become the main direction for trading.
US Dollar Index
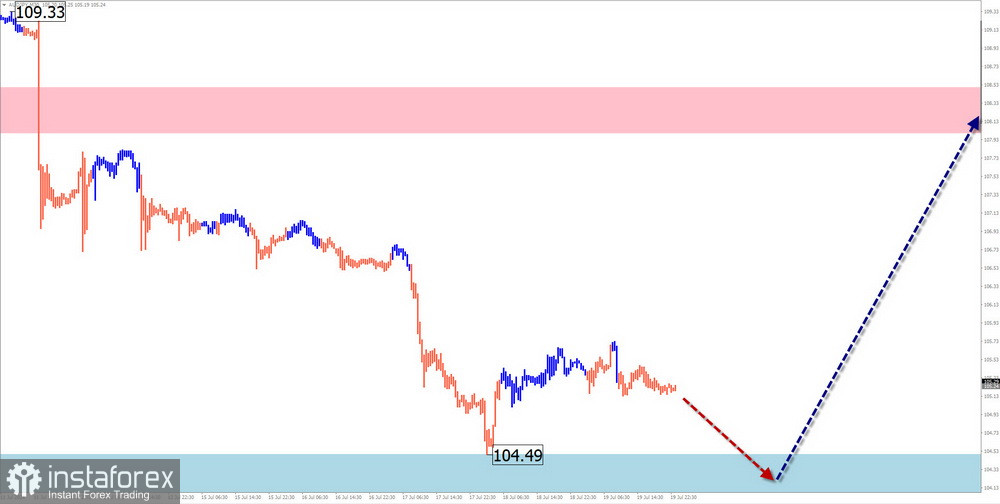
Analysis:
The US dollar quotes continue the movement south on the price chart that started in September last year. After contacting the upper boundary of the potential reversal zone on the daily time frame, the quotes move mainly sideways. The upward section of the chart that started two weeks ago has reversal potential. Upon confirmation, a new short-term trend wave will start.
Forecast:
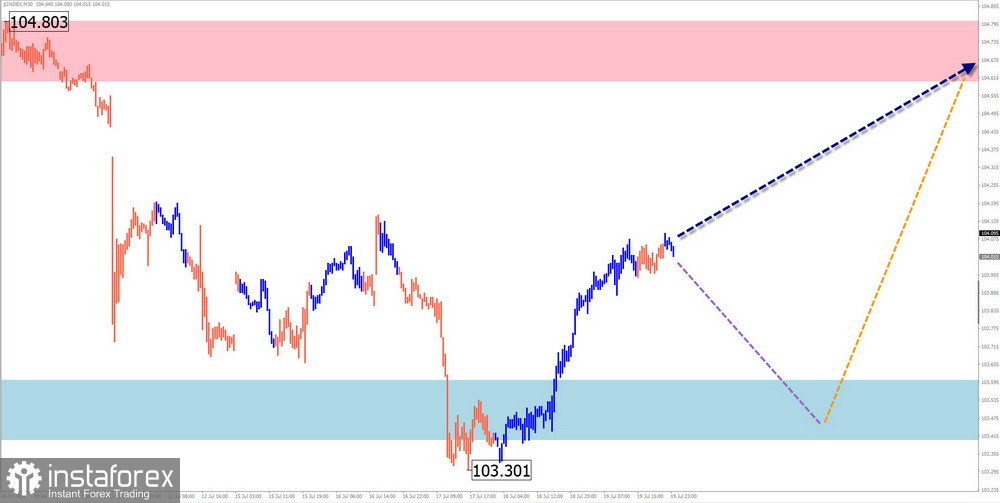
In the next couple of days, the index's downward movement is expected to resume down to the support zone. In the second half of the week, a reversal and continuation of the dollar index's upward movement vector can be expected, with a target growth to the calculated resistance levels.
Potential Reversal Zones:
Resistance:
Support:
Recommendations:
Another short-term weakening phase will soon replace the current strengthening of national currencies. It is worth considering the temporary nature of this phenomenon and preparing for a longer period of weakening of the national currency.
Explanations:
In simplified wave analysis (SWA), all waves consist of 3 parts (A-B-C). Only the last unfinished wave is analyzed in each time frame. The formed structure is shown with a solid line, and expected movements are shown with a dashed line.
Note:
The wave algorithm does not consider the duration of the instruments' movements over time