empty
23.07.2024 07:05 PM
Analysis of GBP/USD Pair on July 23, 2024

This image is no longer relevant

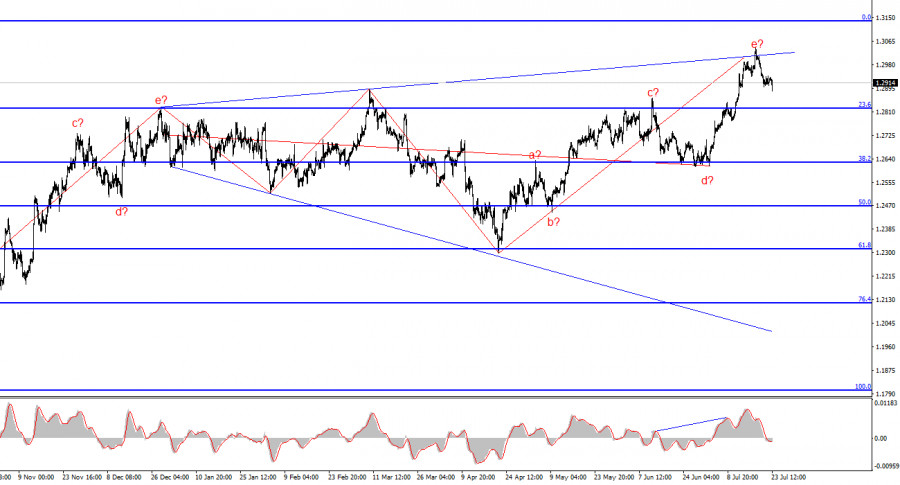
The wave pattern for the GBP/USD pair remains quite complex and very ambiguous. For a while, the wave picture seemed quite convincing, suggesting the formation of a downward set of waves with targets below the 1.2300 level. However, in practice, the demand for the US dollar increased too much to realize this scenario.

At present, the wave pattern has become completely unreadable. I use simple structures in my analysis since complex ones have too many nuances and ambiguities. Now we see an upward wave that overrode a downward one, which overrode the previous upward wave, which overrode the previous downward one. The only thing that can be assumed is an expanding triangle with an upper point around the 1.3000 level and a balancing line around the 1.2600 level. Last week, the upper line of the triangle was reached, and the failed attempt to break it indicates the market's readiness to form a downward set of waves.

The pound is ready to fall, but it needs help

The GBP/USD pair decreased by 15 basis points on Tuesday. This is very little; the market still hesitates to reduce demand for the pound and increase it for the dollar. As we can see, the EUR/USD pair moves much more predictably. The pound has formed a new reversal pattern, an "expanding triangle," but it is not rushing downward even after this. I now doubt the pound even when the overall picture looks completely clear.

The main issue for the pound remains inflation in the UK. The main indicator has decreased to the Bank of England's target, which already allows for the start of easing monetary policy. However, economists have identified a new problem for the BoE that prevents it from transitioning to a looser policy. This problem is inflation in the services sector. It has been found that most of the recent success in reducing inflation has been driven by the goods sector. Prices for goods decreased rapidly, while prices for services decreased more slowly and less significantly. Therefore, in the end, we saw a significant reduction in headline and core inflation, but the services sector continues to cause concern for the British regulator. The BoE may refuse to lower the interest rate at the next meeting in August due to this issue.

The market, which remains supportive of the pound even without this information, feels that the moment of easing in the UK may be postponed for several more months and is in no hurry to sell the pound. It continues to overlook similar factors related to the Fed. Therefore, the GBP/USD pair is expected to decline based on the wave pattern, geometric pattern, the overbought condition of the pound, and news regarding the Fed's monetary policy. However, it will all depend on the market participants. Therefore, I would trust these factors with caution.

This image is no longer relevant

General Conclusions

The wave pattern of the GBP/USD pair still suggests a decline. If a new upward trend section started on April 22, it has already taken on a five-wave form. Therefore, we should now expect at least a three-wave correction. The failed attempt to break the upper line of the triangle indicates the market's readiness to form a downward set of waves. In the near future, considering selling the pair with targets around 1.2820 and 1.2627, corresponding to 23.6% and 38.2% Fibonacci levels, should be considered.

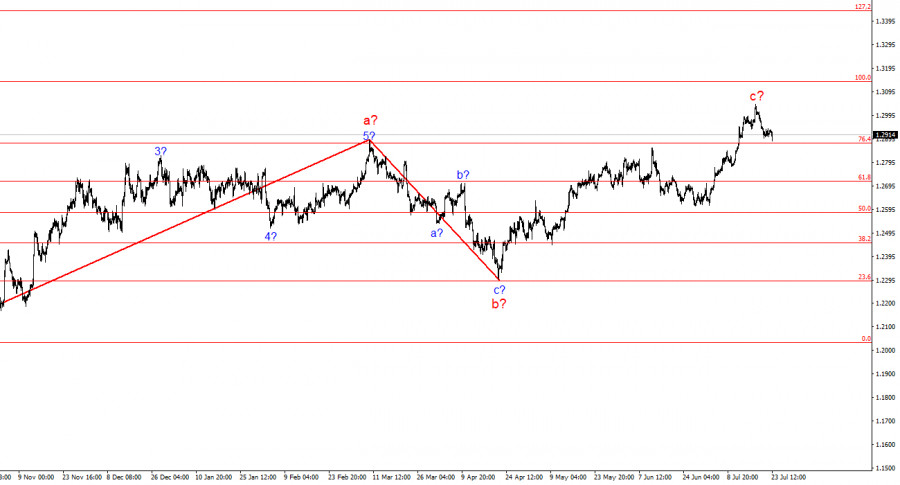
The wave pattern has evolved on the higher time scale. Now, we can assume the formation of a complex and extended upward correction structure. This is currently a three-wave structure but may evolve into a five-wave structure, which could take several more months or longer to complete.

Key Principles of My Analysis:

  1. Wave structures should be simple and understandable. Complex structures are difficult to play out and often change.
  2. If there is uncertainty about market conditions, it is better to avoid entering the market.
  3. There can never be 100% confidence in the direction of movement. Remember protective stop-loss orders.
  4. Wave analysis can be integrated with other types of analysis and trading strategies.
Pilih carta masa
5
min
15
min
30
min
1
jam
4
jam
1
hari
1
minggu
Jana pendapatan melalui perubahan kadar mata wang kripto dengan InstaForex.
Muat turun MetaTrader 4 dan buka dagangan pertama anda.
  • Grand Choice
    Contest by
    InstaForex
    InstaForex always strives to help you
    fulfill your biggest dreams.
    SERTAI PERADUAN

Artikel yang dicadangkan

Analisis untuk GBP/USD pada 26 Mac 2025

Pola gelombang untuk GBP/USD kekal agak samar tetapi secara keseluruhannya boleh dikerjakan. Masih terdapat kebarangkalian tinggi bagi pembentukan aliran menurun jangka panjang. Gelombang 5 telah membentuk dengan jelas, jadi saya

Chin Zhao 17:37 2025-03-26 UTC+2

Ramalan Mingguan Berdasarkan Analisis Gelombang Ringkas untuk GBP/USD, AUD/USD, USD/CHF, EUR/JPY, #Ethereum, #Litecoin – 24 Mac

GBP/USD Analisis: Carta harian pasangan mata wang British menunjukkan struktur gelombang naik yang berterusan sejak 13 Januari tahun ini. Bahagian tengah gelombang (B) sedang berkembang dalam beberapa minggu kebelakangan

Isabel Clark 11:21 2025-03-24 UTC+2

Ramalan Mingguan Berdasarkan Analisis Gelombang Ringkas: EUR/USD, USD/JPY, GBP/JPY, USD/CAD, #Bitcoin, #Ripple – 24 Mac

EUR/USD Analisis: Pemadanan utama euro meneruskan aliran menaik yang bermula pada awal Februari. Harga kekal dalam zon potensi pembalikan yang luas. Sepanjang tiga minggu kebelakangan ini, harga telah membentuk corak

Isabel Clark 11:13 2025-03-24 UTC+2

Analisis untuk GBP/USD pada 21 Mac 2025

Struktur gelombang bagi pasangan GBP/USD masih lagi tidak jelas, namun secara keseluruhan ia masih boleh dikawal. Pada masa ini, terdapat kebarangkalian yang tinggi bahawa satu aliran menurun jangka panjang sedang

Chin Zhao 18:42 2025-03-21 UTC+2

Analisis untuk EUR/USD pada 21 Mac 2025

Pasangan EUR/USD tidak menunjukkan perubahan pada hari Jumaat. Tiada latar belakang berita dalam erti kata langsung hari ini, jadi pasaran tiada apa-apa yang hendak memberi reaksi, dan aktiviti pedagang kekal

Chin Zhao 18:39 2025-03-21 UTC+2

Analisis untuk EUR/USD pada 20 Mac 2025

Struktur gelombang pada carta 4 jam untuk EUR/USD berisiko bertukar menjadi pembentukan yang lebih kompleks. Struktur gelombang menurun baharu mula terbentuk pada 25 September, yang mengambil bentuk dorongan, lima gelombang

Chin Zhao 18:37 2025-03-20 UTC+2

Analisis GBP/USD – 18 Mac

Struktur gelombang bagi GBP/USD kekal agak samar namun secara keseluruhannya masih jelas. Pada masa ini, terdapat kemungkinan tinggi bahawa trend menurun jangka panjang sedang terbentuk. Gelombang 5 telah mengambil bentuk

Chin Zhao 18:45 2025-03-18 UTC+2

Analisis EUR/USD – 18 Mac

Struktur gelombang pada carta empat jam berisiko berubah menjadi bentuk yang lebih kompleks. Sebuah struktur gelombang menurun baharu mula membentuk pada 25 September, mengambil bentuk urutan lima gelombang impuls

Chin Zhao 18:43 2025-03-18 UTC+2

Analisis EUR/USD – 17 Mac

Analisis gelombang empat jam bagi pasangan EUR/USD kini berisiko berubah menjadi struktur yang lebih kompleks. Aliran menurun baharu bermula pada 25 September dalam bentuk struktur impuls lima gelombang. Dua bulan

Chin Zhao 17:34 2025-03-17 UTC+2

Ramalan Mingguan Berdasarkan Analisis Gelombang Ringkas untuk GBP/USD, AUD/USD, USD/CHF, EUR/JPY, #Ethereum, dan #Litecoin – 17 Mac

GBP/USD Semenjak Januari, gelombang kenaikan telah terbentuk pada carta GBP/USD. Analisis struktur gelombang menunjukkan bahawa gelombang ini masih belum lengkap. Selepas menembusi satu lagi tahap rintangan, harga kini berada berhampiran

Isabel Clark 09:34 2025-03-17 UTC+2
Tidak boleh bertanya sekarang?
Tanya soalan anda di Ruangan bersembang.
Panggilan semula Widget
 

Dear visitor,

Your IP address shows that you are currently located in the USA. If you are a resident of the United States, you are prohibited from using the services of InstaFintech Group including online trading, online transfers, deposit/withdrawal of funds, etc.

If you think you are seeing this message by mistake and your location is not the US, kindly proceed to the website. Otherwise, you must leave the website in order to comply with government restrictions.

Why does your IP address show your location as the USA?

  • - you are using a VPN provided by a hosting company based in the United States;
  • - your IP does not have proper WHOIS records;
  • - an error occurred in the WHOIS geolocation database.

Please confirm whether you are a US resident or not by clicking the relevant button below. If you choose the wrong option, being a US resident, you will not be able to open an account with InstaForex anyway.

We are sorry for any inconvenience caused by this message.