empty
06.08.2024 01:29 PM
Forecast for EUR/USD on August 6, 2024

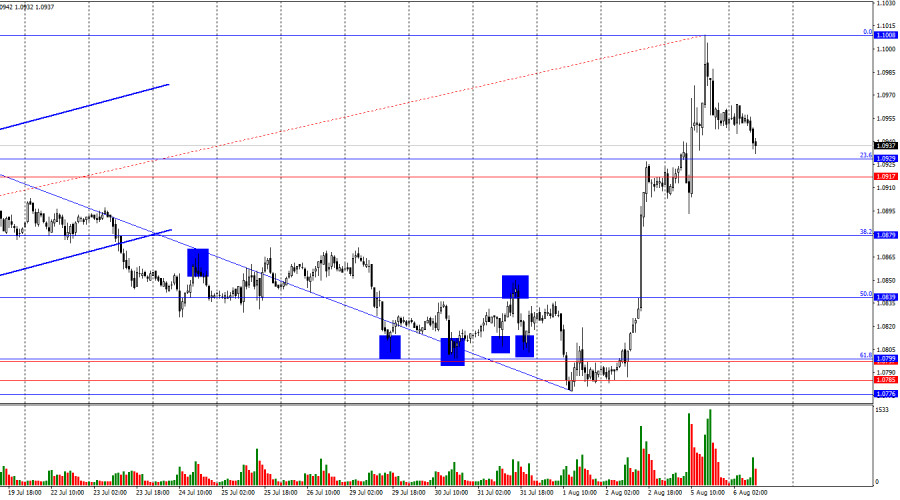
On Monday, the EUR/USD pair continued its growth and managed a rally to the 1.10 level. On the same Monday, there was a reversal in favor of the U.S. dollar, and currently, the quotes have returned to the Fibonacci level of 23.6% at 1.0929. A rebound from this level would work in favor of the European currency and resume growth towards 1.1008. Consolidating below the support zone of 1.0917–1.0929 will increase the likelihood of further declines towards the next corrective level of 38.2% at 1.0879.

This image is no longer relevant

The wave situation has become a bit more complex but generally raises no questions. The last completed downward wave did not break the low of the previous wave, while the new upward wave broke the peak of the previous wave (from July 16). Thus, the "bullish" trend is still intact. For the "bullish" trend to be canceled, bears now need to break the low of the last downward wave, located near the level of 1.0778. Even better would be securing below the zone of 1.0776–1.0799, which acts as the strongest support.

The information background on Monday was not significant. There were few important reports, and the market was in shock after the news about a possible Federal Reserve rate cut in September by 0.50%. These rumors started to emerge after Friday's labor market and unemployment reports. Who spread them is not entirely clear, but many major banks sharply raised their forecasts for monetary policy easing by the end of the year after Friday's statistics in the U.S. However, some banks have not changed their forecasts. Therefore, the opinion that the FOMC will lower the rate by more than 0.50% by the end of the year is not unanimous. Yet, the market immediately panicked, leading to a drop in the dollar. In my opinion, there is still no recession in the U.S. economy. If it were approaching, the Fed would have lowered the rate last week. It is hard to believe that two reports have turned everything upside down in the U.S. economy.

This image is no longer relevant

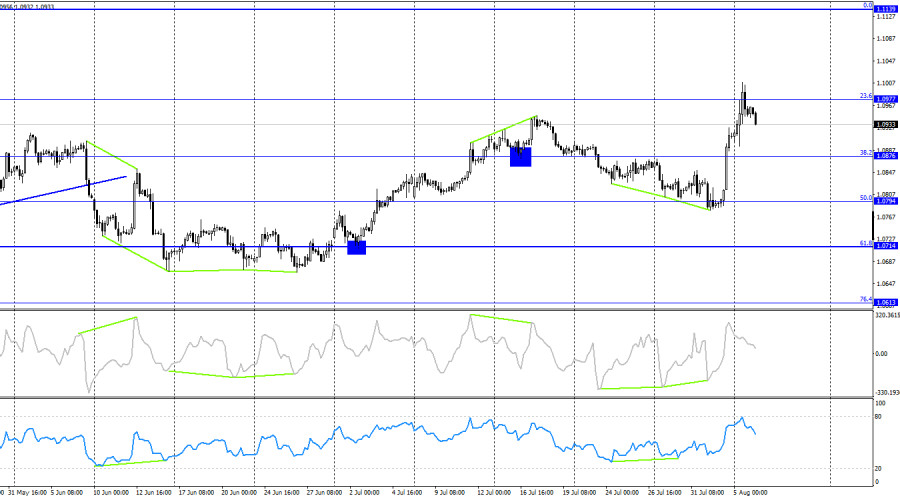
On the 4-hour chart, the pair rebounded from the Fibonacci corrective level of 23.6% at 1.0977 and turned in favor of the U.S. dollar. Thus, the decline in quotes may continue towards the next Fibonacci level of 38.2% at 1.0876. Holding the pair above the level of 1.0977 will increase the likelihood of continued growth towards the next corrective level of 0.0% at 1.1139. No emerging divergences are observed today on any indicator.

Commitments of Traders (COT) Report:

This image is no longer relevant

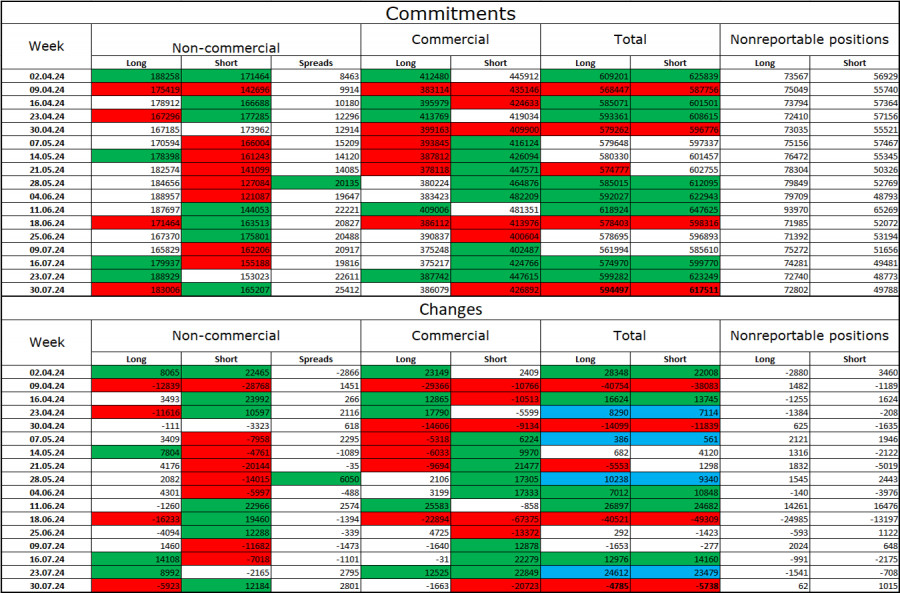
Over the last reporting week, speculators closed 5,923 long positions and opened 12,184 short positions. The mood of the "Non-commercial" group shifted to "bearish" a few months ago, but at this time, the bulls again dominated. The total number of long positions held by speculators now stands at 183,000, while short positions are at 165,000.

I still believe that the situation will continue to change in favor of the bears. I see no long-term reasons to buy the euro, as the ECB has begun easing monetary policy, which will lower the yield on bank deposits and government bonds. In the U.S., however, they will remain high at least until September, making the dollar more attractive to investors. The potential for the European currency to decline looks impressive. However, one should not forget about graphical analysis, which currently does not allow confidently speaking of a strong fall in the euro, as well as about the information background that regularly throws spanners in the works for the dollar.

News Calendar for the U.S. and Eurozone:

Eurozone - Retail Sales (09-00 UTC).

On August 6, the economic events calendar contains only one entry. The impact of the information background on traders' mood today may be very weak.

Forecast for EUR/USD and Advice to Traders:

Sales of the pair are possible today with a target of 1.0879 on the hourly chart if quotes consolidate below the support zone of 1.0917–1.0929. Purchases will be possible upon a bounce from the support zone of 1.0917–1.0929 on the hourly chart with a target of 1.1008.

Fibonacci level grids are constructed from 1.0668–1.1008 on the hourly chart and from 1.0450–1.1139 on the 4-hour chart.

Ringkasan
Segera
Analitic
Grigory Sokolov
Mulakan perdagangan
Jana pendapatan melalui perubahan kadar mata wang kripto dengan InstaForex.
Muat turun MetaTrader 4 dan buka dagangan pertama anda.
  • Grand Choice
    Contest by
    InstaForex
    InstaForex always strives to help you
    fulfill your biggest dreams.
    SERTAI PERADUAN

Artikel yang dicadangkan

Ramalan untuk EUR/USD pada 11 Ogos 2025

Pada hari Jumaat, EUR/USD membuat dua lantunan daripada zon sokongan 1.1637–1.1645 sebelum beralih memihak kepada euro. Keadaan ini memberi isyarat bahawa pergerakan menaik berpotensi diteruskan hari ini menuju paras anjakan

Samir Klishi 10:44 2025-08-11 UTC+2

Ramalan untuk GBP/USD pada 11 Ogos, 2025

Pada carta jam, GBP/USD pada hari Jumaat telah membuat dua pantulan dari tahap 1.3425, dan pada hari Isnin terus bergerak ke atas menuju tahap penarikan semula 76.4% di 1.3470. Pantulan

Samir Klishi 10:25 2025-08-11 UTC+2

GBP/USD. Analisis Teknikal untuk Minggu 11–16 Ogos

Analisis Aliran Minggu ini, dari paras 1.3450 (hampir dengan penutupan lilin mingguan terakhir), harga mungkin mula bergerak menurun ke arah 1.3270 – paras sokongan bersejarah (garis putus-putus biru). Setelah menguji

Stefan Doll 10:02 2025-08-11 UTC+2

EUR/USD. Analisis Teknikal untuk Minggu 11–16 Ogos

Minggu lepas, pasangan ini bergerak ke atas, hampir menguji tahap rintangan sejarah pada 1.1710 (garisan titik biru), dan kemudian berpatah ke bawah, menutup graf lilin mingguan pada 1.1641. Pada minggu

Stefan Doll 09:55 2025-08-11 UTC+2

GBP/USD. Analisis Penunjuk pada 11 Ogos 2025

Pada hari Jumaat, pasangan mata wang ini bergerak ke bawah, menguji tahap penarikan semula 61.8% pada 1.3416 (garisan putus-putus merah), dan kemudian naik, menutup lilin harian pada 1.3450. Hari

Stefan Doll 09:53 2025-08-11 UTC+2

EUR/USD. Analisis Penunjuk pada 11 Ogos 2025

Pada hari Jumaat, pasangan mata wang tersebut bergerak menurun, hampir menguji paras pembetulan 23.6% pada 1.1626 (garis putus-putus biru), sebelum harga meningkat sedikit dan menutup lilin harian pada 1.1641. Hari

Stefan Doll 09:40 2025-08-11 UTC+2

Jika USD/JPY berjaya melepasi tahap Pivot, ia mempunyai potensi untuk terus mengukuh. Isnin, 11 Ogos 2025.

[USD/JPY] – [Isnin, 11 Ogos 2025] Walaupun keadaan USD/JPY masih bergerak secara mendatar, seperti yang ditunjukkan oleh EMA yang bertindih, penembusan dan penutupan USD/JPY di atas tahap Pivotnya memberikan peluang

Arief Makmur 07:37 2025-08-11 UTC+2

NZD/USD masih berpeluang untuk terus mengukuh ke tahap rintangan terdekatnya. Isnin, 11 Ogos 2025.

[NZD/USD] – [Isnin, 11 Ogos 2025] Dengan kedua-dua EMA membentuk Golden Cross dan penunjuk RSI(14) berada pada tahap Neutral-Bullish, Kiwi berpotensi untuk mengukuh pada hari ini. Paras Utama Rintangan

Arief Makmur 07:37 2025-08-11 UTC+2

Ramalan EUR/USD untuk 11 Ogos 2025

Euro kini semakin kukuh pada tahap sokongan 1.1632. Semakin lama ia mengukuh di situ, semakin seimbang kebarangkalian pertumbuhan dan penurunan akan menjadi. Walau bagaimanapun, terdapat dua faktor yang mempengaruhi struktur

Laurie Bailey 05:01 2025-08-11 UTC+2

Ramalan GBP/USD untuk 11 Ogos 2025

Pound British kini berada dalam fasa pengukuhan pada paras tertinggi yang baru dicapai, iaitu di tahap pertumbuhan jangka pendek pertengahan 1.3452. Penembusan kukuh di atas paras ini berpotensi membuka laluan

Laurie Bailey 05:01 2025-08-11 UTC+2
Tidak boleh bertanya sekarang?
Tanya soalan anda di Ruangan bersembang.
Panggilan semula Widget
 

Dear visitor,

Your IP address shows that you are currently located in the USA. If you are a resident of the United States, you are prohibited from using the services of InstaFintech Group including online trading, online transfers, deposit/withdrawal of funds, etc.

If you think you are seeing this message by mistake and your location is not the US, kindly proceed to the website. Otherwise, you must leave the website in order to comply with government restrictions.

Why does your IP address show your location as the USA?

  • - you are using a VPN provided by a hosting company based in the United States;
  • - your IP does not have proper WHOIS records;
  • - an error occurred in the WHOIS geolocation database.

Please confirm whether you are a US resident or not by clicking the relevant button below. If you choose the wrong option, being a US resident, you will not be able to open an account with InstaForex anyway.

We are sorry for any inconvenience caused by this message.