Dalam ramalan pagi, saya menumpukan perhatian pada paras 1.3086 dan merancang untuk membuat keputusan kemasukan pasaran berdasarkan paras ini. Mari kita lihat carta 5-minit dan menganalisis apakah yang berlaku. Terdapat kenaikan, tetapi ia terlalu kecil untuk pasangan itu mencapai paras 1.3086. Volatiliti pasaran yang rendah memaksa saya untuk menyesuaikan gambaran teknikal untuk separuh kedua hari ini.
Untuk Membuka Kedudukan Panjang (Beli) pada pasangan GBP/USD:
Ucapan beberapa ahli FOMC adalah satu-satunya acara yang dijangka semasa sesi urusniaga Amerika Syarikat, jadi saya tidak menjangkakan pergerakan ketara dalam pasangan ini dan akan berpegang kepada strategi berdagang dalam saluran mendatar. Jika pound menurun, satu penembusan palsu pada paras 1.3024 (rendah mingguan) boleh menawarkan peluang untuk pemulihan menuju rintangan 1.3078, yang terbentuk pada separuh pertama hari ini. Satu penembusan dan ujian semula dari julat ini dari atas ke bawah akan meningkatkan peluang aliran menaik pada awal minggu. Ini akan memukul pesanan menghentikan jualan dan menyediakan titik kemasukan yang kukuh untuk kedudukan panjang dengan sasaran 1.3131. Sasaran terakhir ialah 1.3171, di mana saya merancang untuk mengambil untung. Jika pasnagan GBP/USD menurun dan kenaikan harga tidak menunjukkan aktiviti pada 1.3024 pada separuh kedua hari ini, tekanan menurun akan berlanjutan. Ini boleh menyebabkan penurunan selanjutnya dan retest pada sokongan 1.2975. Hanya penembusan palsu pada paras itu akan membenarkan pembukaan kedudukan panjang. Saya merancang untuk membeli GBP/USD pada lantunan dari rendah 1.2941, mensasarkan pembetulan menaik 30-35 mata dalam sehari.
Untuk Membuka Kedudukan Pendek (Jual) pada pasangan GBP/USD:
Para penjual tidak tergesa-gesa untuk bertindak, memberikan ruang untuk pembetulan pound pada awal minggu ini. Namun, pergerakan menurun perlu memastikan harga kekal di bawah tahap rintangan 1.3078. Penembusan palsu di tahap ini akan menjadi titik masuk yang baik untuk kedudukan jual, dengan sasaran penurunan ke sokongan 1.3024—paras terendah mingguan dan bulanan. Penembusan dan ujian semula dari bawah ke atas akan melemahkan kedudukan pembeli, mencetuskan pesanan henti rugi (SL) dan membuka laluan ke 1.2975. Sasaran akhir adalah 1.2941, di mana saya merancang untuk mengambil keuntungan. Ujian di tahap ini akan mengukuhkan lagi pasaran penurunan harga. Jika pasangan GBP/USD meningkat dan penjual tetap tidak aktif di tahap 1.3086 pada separuh kedua hari, pembeli akan cuba mendapatkan semula kawalan pasaran. Ketika itu, penjual tidak akan mempunyai pilihan selain berundur ke kawasan rintangan 1.3131, yang mungkin menjadi sempadan atas saluran mendatar. Saya akan menjual di sana hanya pada penembusan palsu. Jika tiada pergerakan menurun, saya akan mencari kedudukan jual pada pemulihan dari 1.3171, dengan sasaran pembetulan 30-35 pip dalam sehari.
Laporan COT (Commitment of Traders) bagi 1 Oktober menunjukkan peningkatan dalam kedudukan panjang dan sedikit penurunan dalam kedudukan pendek. Statistik terbaharu UK menimbulkan cabaran tambahan untuk pembelian pound seterusnya, tetapi terdapat sedikit minat untuk menjual berdasarkan penunjuk semasa. Walau bagaimanapun, perlu diingatkan bahawa laporan ini tidak mengambil kira perubahan pasaran terkini yang berlaku akhir minggu lepas selepas pelepasan data pasaran buruh yang kukuh. Oleh demikian, terlalu memberi tumpuan kepada laporan ini mungkin tidak memberi manfaat. Menurut laporan COT terbaharu, kedudukan panjang bukan komersial meningkat sebanyak 6,144 kepada keseluruhan 161,469, sementara kedudukan pendek bukan komersial menurun sebanyak 629 kepada keseluruhan 67,704. Hasilnya, jurang antara kedudukan panjang dan pendek mengecil sebanyak 100.
Isyarat Penunjuk:
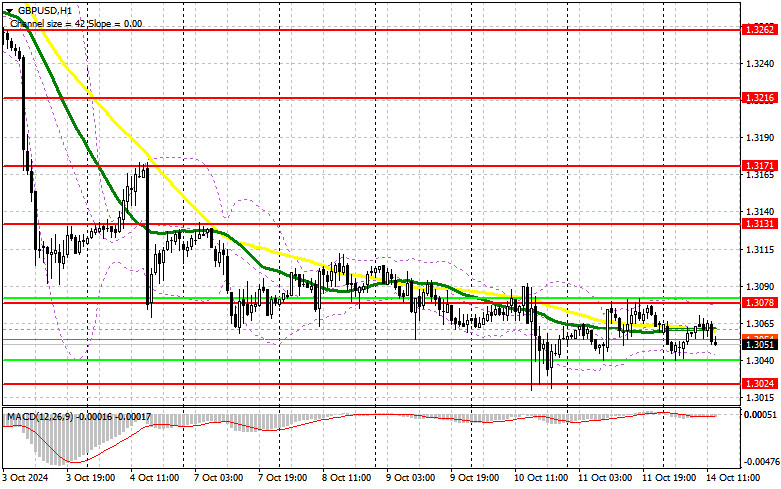
Purata Bergerak:
Pasangan mata wang ini sedang berdagang di sekitar purata bergerak 30 dan 50 hari, menunjukkan pasaran mendatar.
Nota: Purata bergerak yang dibincangkan di sini adalah berdasarkan carta H1 setiap jam dan berbeza daripada purata bergerak harian yang biasanya digunakan pada carta D1.
Bollinger Bands:
Jika pasangan ini menurun, had bawah Bollinger Bands sekitar 1.3040 akan bertindak sebagai sokongan.
Penerangan penunjuk:
- Purata Bergerak: Menyelaraskan volatiliti dan gangguan untuk menentukan arah aliran semasa. Tempoh 50, ditandakan dengan warna kuning.
- Purata Bergerak: Tempoh 30, ditandakan dengan warna hijau.
- Penunjuk MACD: EMA pantas tempoh 12, EMA perlahan tempoh 26, SMA tempoh 9.
- Bollinger Bands: Tempoh 20.
- Pedagang bukan komersial: Spekulator seperti pedagang individu, dana lindung nilai, dan institusi besar.
- Kedudukan panjang bukan komersial: Jumlah keseluruhan kedudukan beli yang dipegang oleh pedagang bukan komersial.
- Kedudukan pendek bukan komersial: Jumlah keseluruhan kedudukan jual yang dipegang oleh pedagang bukan komersial.
- Kedudukan bersih bukan komersial: Perbezaan antara kedudukan pendek dan panjang yang dipegang oleh pedagang bukan komersial.


