

signal strength 1 of 5
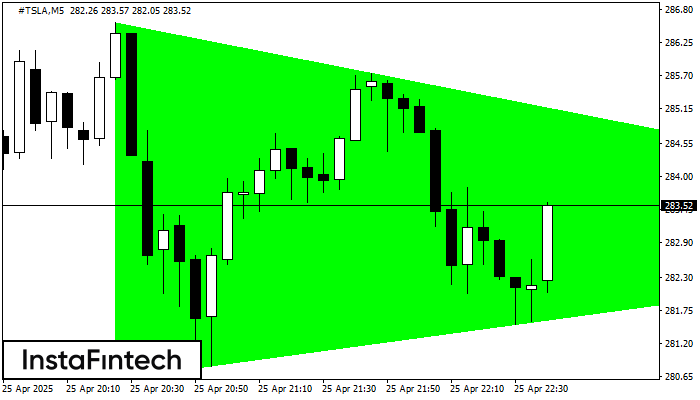
According to the chart of M5, #TSLA formed the Bullish Symmetrical Triangle pattern. Description: This is the pattern of a trend continuation. 286.59 and 280.59 are the coordinates of the upper and lower borders respectively. The pattern width is measured on the chart at 600 pips. Outlook: If the upper border 286.59 is broken, the price is likely to continue its move by 283.19.
The M5 and M15 time frames may have more false entry points.
- All
- Double Top
- Flag
- Head and Shoulders
- Pennant
- Rectangle
- Triangle
- Triple top
- All
- #AAPL
- #AMZN
- #Bitcoin
- #EBAY
- #FB
- #GOOG
- #INTC
- #KO
- #MA
- #MCD
- #MSFT
- #NTDOY
- #PEP
- #TSLA
- #TWTR
- AUDCAD
- AUDCHF
- AUDJPY
- AUDUSD
- EURCAD
- EURCHF
- EURGBP
- EURJPY
- EURNZD
- EURRUB
- EURUSD
- GBPAUD
- GBPCHF
- GBPJPY
- GBPUSD
- GOLD
- NZDCAD
- NZDCHF
- NZDJPY
- NZDUSD
- SILVER
- USDCAD
- USDCHF
- USDJPY
- USDRUB
- All
- M5
- M15
- M30
- H1
- D1
- All
- Buy
- Sale
- All
- 1
- 2
- 3
- 4
- 5
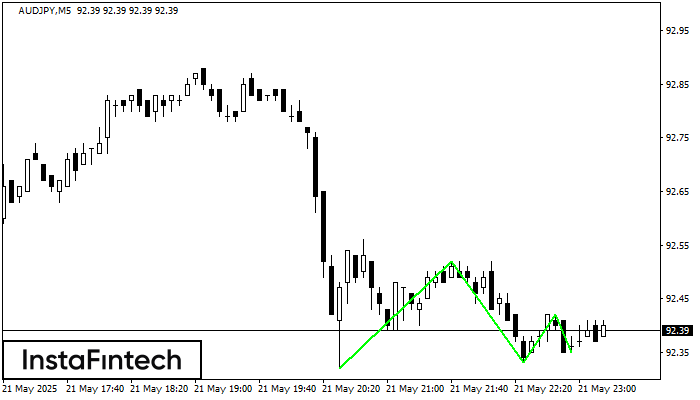
Corak Triple Bottom telah dibentuk pada carta AUDJPY M5. Ciri-ciri corak: Garisan bawah corak mempunyai koordinat 92.52 dengan had atas 92.52/92.42, unjuran lebar adalah 20 mata. Pembentukan corak Triple Bottom
Carta masa M5 dan M15 mungkin mempunyai lebih banyak titik kemasukan palsu.
Open chart in a new window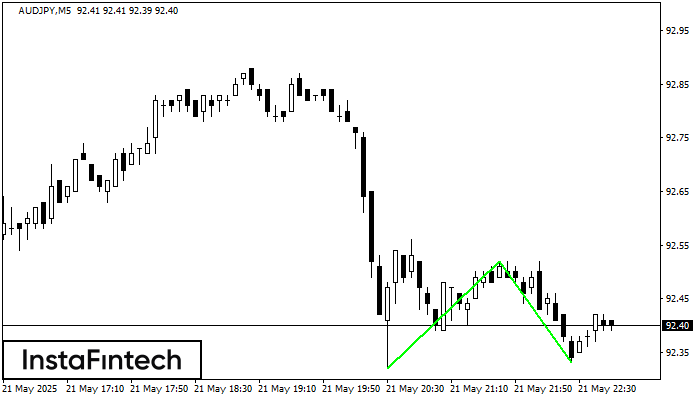
Corak Double Bottom telah dibentuk pada AUDJPY M5; sempadan atas adalah 92.52; sempadan bawah adalah 92.33. Lebar corak adalah 20 mata. Sekiranya penembusan sempadan atas 92.52, perubahan aliran boleh diramalkan
Carta masa M5 dan M15 mungkin mempunyai lebih banyak titik kemasukan palsu.
Open chart in a new window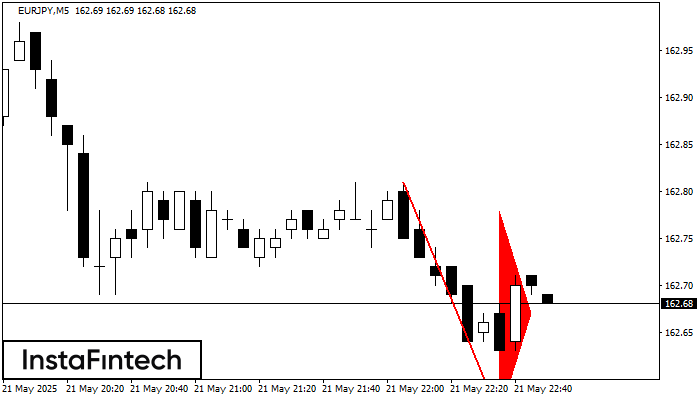
Corak Pennant Aliran Menurun telah dibentuk pada carta EURJPY M5. Jenis corak ini dicirikan oleh sedikit penurunan di mana selepas itu harga akan bergerak ke arah aliran asal. Sekiranya harga
Carta masa M5 dan M15 mungkin mempunyai lebih banyak titik kemasukan palsu.
Open chart in a new window


