

signal strength 1 of 5

The Triple Bottom pattern has been formed on EURUSD M5. It has the following characteristics: resistance level 1.0936/1.0923; support level 1.0906/1.0904; the width is 30 points. In the event of a breakdown of the resistance level of 1.0936, the price is likely to continue an upward movement at least to 1.0916.
The M5 and M15 time frames may have more false entry points.
- All
- Double Top
- Flag
- Head and Shoulders
- Pennant
- Rectangle
- Triangle
- Triple top
- All
- #AAPL
- #AMZN
- #Bitcoin
- #EBAY
- #FB
- #GOOG
- #INTC
- #KO
- #MA
- #MCD
- #MSFT
- #NTDOY
- #PEP
- #TSLA
- #TWTR
- AUDCAD
- AUDCHF
- AUDJPY
- AUDUSD
- EURCAD
- EURCHF
- EURGBP
- EURJPY
- EURNZD
- EURRUB
- EURUSD
- GBPAUD
- GBPCHF
- GBPJPY
- GBPUSD
- GOLD
- NZDCAD
- NZDCHF
- NZDJPY
- NZDUSD
- SILVER
- USDCAD
- USDCHF
- USDJPY
- USDRUB
- All
- M5
- M15
- M30
- H1
- D1
- All
- Buy
- Sale
- All
- 1
- 2
- 3
- 4
- 5
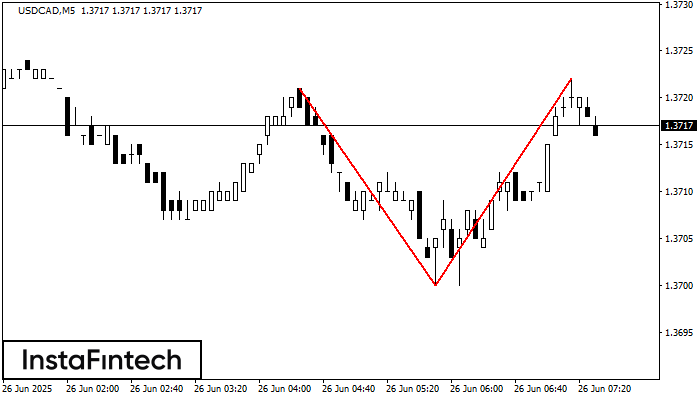
On the chart of USDCAD M5 the Double Top reversal pattern has been formed. Characteristics: the upper boundary 1.3722; the lower boundary 1.3700; the width of the pattern 22 points
The M5 and M15 time frames may have more false entry points.
Open chart in a new window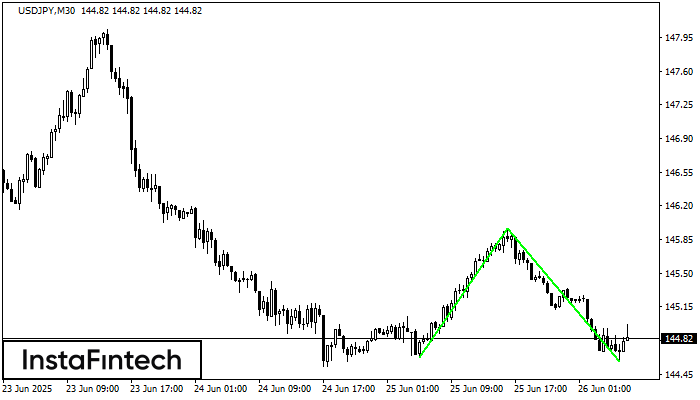
The Double Bottom pattern has been formed on USDJPY M30. Characteristics: the support level 144.62; the resistance level 145.96; the width of the pattern 134 points. If the resistance level
Open chart in a new window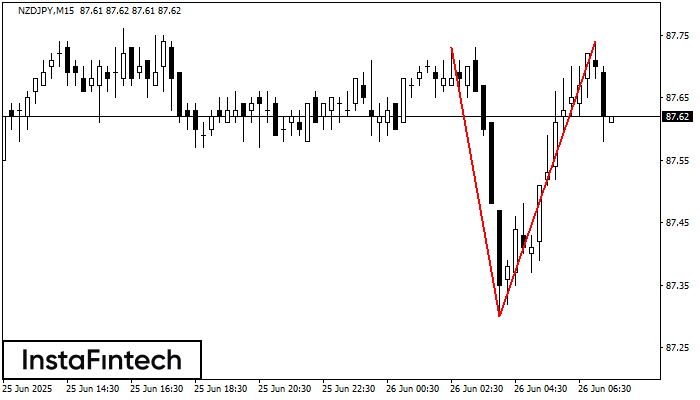
The Double Top reversal pattern has been formed on NZDJPY M15. Characteristics: the upper boundary 87.73; the lower boundary 87.30; the width of the pattern is 44 points. Sell trades
The M5 and M15 time frames may have more false entry points.
Open chart in a new window


