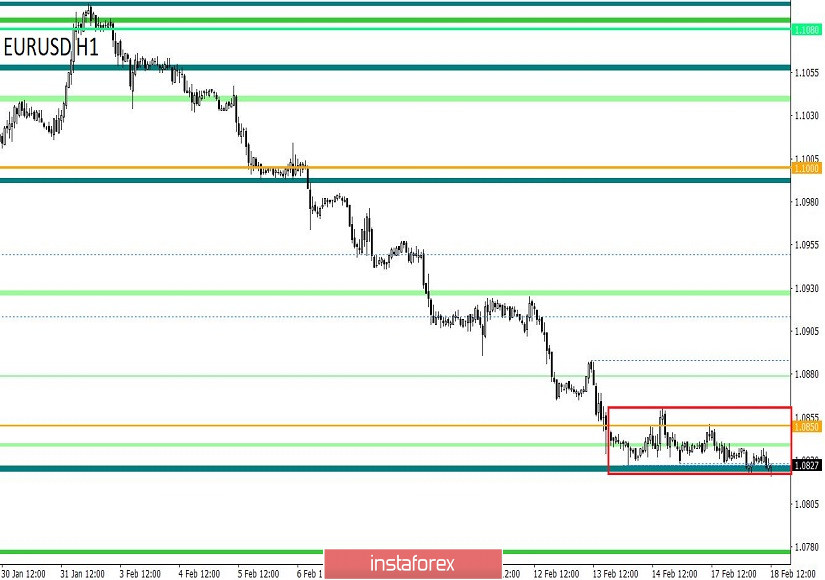
From a comprehensive analysis, we see a strong accumulation within the level of 1.0850, where the oscillation amplitude is extremely small. Now, about the details. The downward movement set a month ago is still maintained in the market, where the quote reached the interaction level of 1.0850, forming an accumulation near it. A notable point was that the accumulation has been held for more than 50 hours, which means that the concentration of trading forces has already reached the chapel and a surge of activity can occur at any time. Keeping the quote at low levels confirms the previously deduced theory of a global downward trend, where market participants on the occasion of FOMO (lost-profit syndrome) will not let the price go into a technical correction, overheating further short positions. Here, we have both pros and cons. On the positive side, we can highlight the lack of fear of the psychological ranges that are located under the quote. The downside is that overheating short positions will not lead to anything, and the stability we hold on to will be disrupted.
At the same time, the pressure of sellers can be understood, the recently passed oblong correction delayed them for more than four months, and the current achievements of traders have not seen for several years. So we drag the quote down, not paying attention to the entire logical process of bar structure.
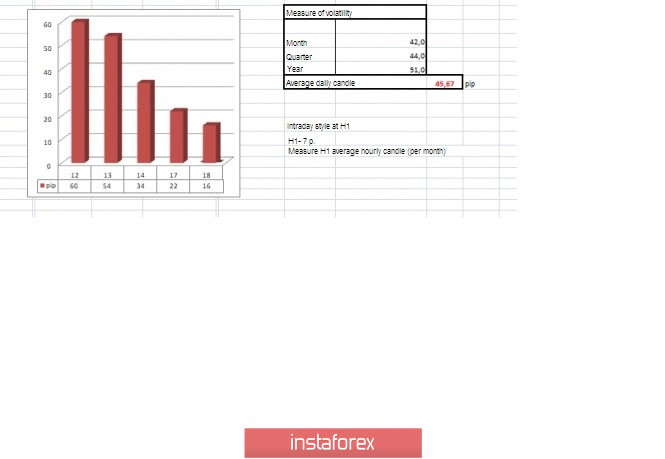
In terms of volatility, we record a kind of slowdown relative to the prolonged accumulation. A notable point was that the last day was one of the most inactive in comparison with the periods before. The dynamics shrank to the point that about half of the average daily indicator was lost. See the volatility table at the end of the article.
Analyzing the past day by the minute, we see all the same variables of the border of 1.0827/1.0861, where the movement occurred in the direction of the lower frame.
As discussed in the previous review, traders are divided into two fronts: some have chosen the medium-term side, where they continue to hold short positions, while others are considering speculations about the limits of their accumulation.
Looking at the trading chart in general terms (daily period), we see that since the beginning of February, the movement is vertical, where there is no rollback and correction. At the same time, the global downward trend is at the stage of movement, where the 2017 values are already located under the quote.
The news background of the previous day had no statistical data and trading volumes were reduced due to the absence of the United States market, which celebrated Presidents' Day. Now, we understand the reason for such a strong decline in activity in terms of volatility, as we wrote above.
In terms of the general information background, we see that the pressure on the market remains due to a number of toxic topics:
- Upcoming negotiations between Britain and Brussels on trade relations, where the escalation of interests is recorded;
- Coronavirus and the increase in the number of infected;
- ECB monetary policy and actions in terms of modernization.
Today, in terms of the economic calendar, we do not have data worth paying attention to in Europe and the United States, so the emphasis will be placed on the technical part, as well as on the toxic background.
Further development
Analyzing the current trading chart, we see that the quote concentration is still within the reach of the accumulation framework, which is not quite a breakdown of the set boundaries. In fact, the price will go beyond the limits of accumulation, which has been preserved for more than two hundred years, and this is confirmed by the instability relative to current fluctuations. Whether the quote will be able to continue the downward course, of course, only in the absence of a technical correction, you should not expect an extremely strong gain from the passed level of 1.0850.
By detailing the available time interval per minute, we fix the fluctuation within the lower limit of the accumulation of 1.0827/1.0861, where the activity is still very small.
In terms of the emotional mood of market participants, we see that the accumulation has focused on itself the special attention of speculators who are waiting for the first impulse outside the borders.
In turn, medium-term traders do not change their traditions and continue to hold short positions. Even technical correction is not a hindrance for them. At the same time, speculators are waiting for the acceleration and the appearance of the first impulse candle relative to the specified accumulation limits.
It is likely to assume that the accumulation is extremely unstable and fixing the price below the border of 1.0827 signals this. It is likely to assume that the FOMO (lost-profit syndrome) has been underestimated and its consequences are still ahead of us. Now, the downward move is considered as the basis and the technical correction as a prospect. It is advised to wait for the appearance of an impulse that signals the completion of the accumulation process, otherwise, a return to the frame of stagnation is still possible.
Based on the above information, we will output trading recommendations:
- Buy positions will be considered if the price is fixed higher than 1.0865, and in case of a further downward move, the technical correction point will be revised.
- Positions for sale are already held by traders both intraday and medium-term. Speculators will soon join us.
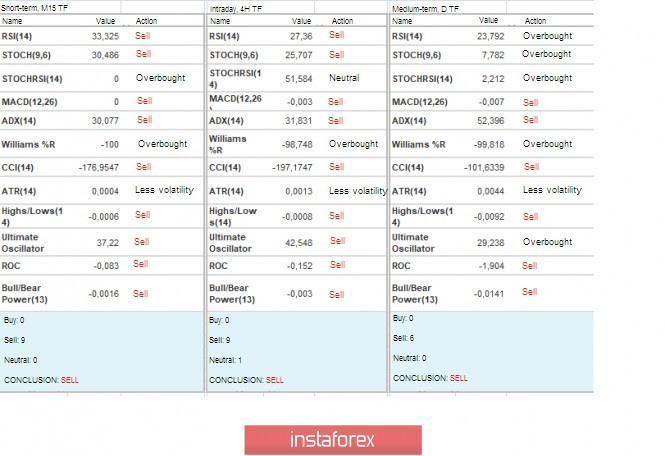
Indicator analysis
Analyzing different sectors of timeframes (TF), we see that the indicators of technical instruments are considering a further decline. It is worth considering that while we are within the limits of accumulation, indicators for smaller periods may be variable.
Volatility for the week / Volatility Measurement: Month; Quarter; Year.
The volatility measurement reflects the average daily fluctuation from the calculation for the Month / Quarter / Year.
(February 18 was based on the time of publication of the article)
The volatility of the current time is 16 points, which is an extremely low value. It is likely to assume that in the event of a breakdown of the accumulation framework, there may be an acceleration due to the absence of the United States market. Volumes may be reduced, which will affect activity. At the same time, if the accumulation breaks down, a local surge may occur, which will affect the volatility.
Key levels
Resistance zones: 1.0850**; 1.0879*; 1.0900/1.0950**;1.1000***; 1.1080**; 1.1180; 1.1300**; 1.1450; 1.1550; 1.1650*; 1.1720**; 1.1850**; 1.2100.
Support zones: 1.0850**; 1.0700; 1.0500***; 1.0350**; 1.0000***.
* Periodic level
** Range level
*** Psychological level
***** The article is based on the principle of conducting a transaction, with daily adjustments.