Analysis of previous deals:
30M chart of the EUR/USD pair
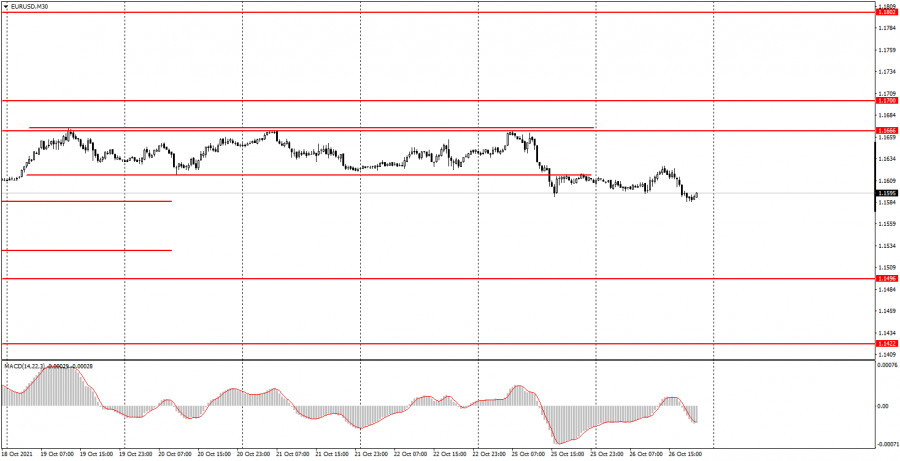
After a rather active Monday, the EUR/USD pair returned to its usual trading mode on Tuesday. Today's volatility was 40 points, and there was no trend movement within the day. Although it is better to say that the trend movement was absent on any timeframes. We haven't seen a trend movement on the 30-minute chart for several weeks: at first the pair was inside one horizontal channel, then inside the second. Yesterday the quotes of the pair left the last horizontal channel, however, as we can see, there is no trend at this time, and the price is now slightly below the horizontal channel. Consequently, the trend is still absent now, and it is still not recommended to consider signals from the MACD indicator. As for the macroeconomic background, only one more or less significant report was published today - the indicator of consumer confidence in the United States, which rose from 109.8 points to 113.8 points. We can say that it helped the dollar a bit, since the dollar continued to rise in price after it was published. However, please note that the strength of the movement after this report has not changed, so this may be a simple coincidence.
5M chart of the EUR/USD pair
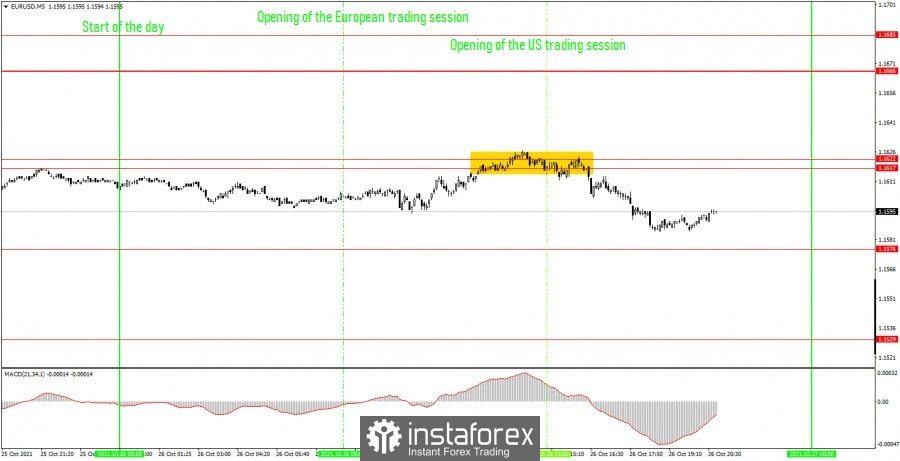
The technical picture on the 5-minute timeframe looks, oddly enough, very good. Despite the fact that the pair spent the entire day in indistinct movements again, one trading signal was still formed. Although it was, to put it mildly, not the most accurate. However, what else can you expect in an almost absolute flat with low volatility? It's good that there was only one signal and not a false one. One way or another, the EUR/USD pair bounced off the resistance area of 1.1617-1.1622, which was a sell signal. Thus, novice traders could open short positions at this point. Fortunately, the downward movement continued and at the current moment the price has failed to reach the nearest target level of 1.1576. Thus, a short position should be manually closed at a profit of about 18 points. This result is excellent considering the overall volatility of the instrument. Unfortunately, in general, rather vague movements continue, in which it is very difficult to count on serious profits.
How to trade on Wednesday:
The pair left another horizontal channel on the 30-minute timeframe, but there is still no trend at this time. Thus, it is still not very convenient to trade on the 30-minute TF, and we still do not recommend tracking signals from the MACD indicator. We advise you to wait for the formation of a trendline or trend channel. The key levels on the 5-minute timeframe for October 27 are 1.1576, 1.1617 - 1.1622, 1.1666 and 1.1685. Take Profit, as before, is set at a distance of 30-40 points. Stop Loss - to breakeven when the price passes in the right direction by 15 points. At the 5M TF, the target can be the nearest level if it is not too close or too far away. If it is, then you should act according to the situation or work according to Take Profit. On Wednesday, the only more or less important report will be US durable goods orders. This report cannot be called secondary, it used to often provoke a reaction from the markets. However, over the past year, markets have barely responded to it. Consequently, the discrepancy between the actual value and the predicted value must be very large for market participants to react.
Basic rules of the trading system:
1) The signal strength is calculated by the time it took to form the signal (bounce or overcome the level). The less time it took, the stronger the signal.
2) If two or more deals were opened near a certain level based on false signals (which did not trigger Take Profit or the nearest target level), then all subsequent signals from this level should be ignored.
3) In a flat, any pair can form a lot of false signals or not form them at all. But in any case, at the first signs of a flat, it is better to stop trading.
4) Trade deals are opened in the time period between the beginning of the European session and until the middle of the American one, when all deals must be closed manually.
5) On the 30-minute TF, using signals from the MACD indicator, you can trade only if there is good volatility and a trend, which is confirmed by a trend line or a trend channel.
6) If two levels are located too close to each other (from 5 to 15 points), then they should be considered as an area of support or resistance.
On the chart:
Support and Resistance Levels are the Levels that serve as targets when buying or selling the pair. You can place Take Profit near these levels.
Red lines are the channels or trend lines that display the current trend and show in which direction it is better to trade now.
The MACD indicator (14,22,3) consists of a histogram and a signal line. When they cross, this is a signal to enter the market. It is recommended to use this indicator in combination with trend lines (channels and trend lines).
Important speeches and reports (always contained in the news calendar) can greatly influence the movement of a currency pair. Therefore, during their exit, it is recommended to trade as carefully as possible or exit the market in order to avoid a sharp price reversal against the previous movement.
Beginners on Forex should remember that not every single trade has to be profitable. The development of a clear strategy and money management are the key to success in trading over a long period of time.


