Analysis of Tuesday's deals:
30M chart of the GBP/USD pair
The GBP/USD pair showed a very volatile movement on Tuesday, more than 150 points per day. Formally, there was an exit from the horizontal channel, but the price returned to it very quickly. Thus, at the end of the day, we can also conclude that the technical picture has not changed at all. Moreover, it is rather difficult to say what caused the rather strong movement during the day, if no important macroeconomic report has been published. There were also no important fundamental events, neither in the UK nor in the US. Therefore, it is rather difficult to say why the pair has passed as many as 150 points. Nevertheless, we are inclined to believe that the flat still remains. The movement from the past few days can also be described as a swing. The essence of the matter does not change. The fact remains that there is no trend movement at this time.
5M chart of the GBP/USD pair
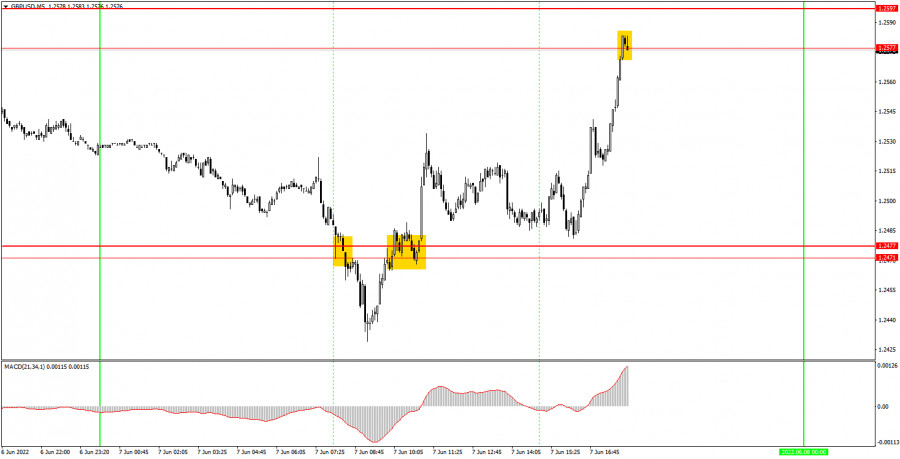
The movement was quite good on the 5-minute timeframe on Friday. Despite the fact that the movement looks flat on the 30-minute time frame, we had a clear trend today on the 5-minute time frame, although the pair often changed direction during the day. However, due to the fact that the levels were chosen correctly, as well as due to their small number, there were few trading signals and all of them were not bad. The first sell signal was formed after overcoming the area of 1.2471-1.2477. After it was formed, the price went down about 30 points, but failed to reach the nearest target level of 1.2371, however, Stop loss could be set to breakeven, so there was no loss on the transaction. The next buy signal was formed when the price settled above the area of 1.2471-1.2477. After that, it went up about 90 points and ideally reached the level of 1.2577, where it was necessary to take profit on the deal. Therefore, novice traders could get 80 points of profit today, which is very good, given the not the best nature of the pair's movement.
How to trade on Wednesday:
The upward trend is formally canceled on the 30-minute timeframe, however, the pair continues to remain close to its local peaks. At this time, the pair is not exactly within the horizontal channel of 1.2471-1.2477, and only the exit from it will signal the end of the flat. Moreover, even overcoming any of the boundaries cannot guarantee the completion of a flat or "swing". The traffic is very strange right now. On the 5-minute TF it is recommended to trade at the levels 1.2371, 1.2471-1.2477, 1.2577, 1.2597-1.2616, 1.2659-1.2674. When the price passes after opening a deal in the right direction for 20 points, Stop Loss should be set to breakeven. The UK is set to publish only not the most important index of business activity in the construction industry. Meanwhile, the calendar of news and events is completely empty in the US. Thus, novice traders will again have nothing to react to during the day. However, today has shown that volatility, even in this state of affairs, can be very high.
Basic rules of the trading system:
1) The signal strength is calculated by the time it took to form the signal (bounce or overcome the level). The less time it took, the stronger the signal.
2) If two or more deals were opened near a certain level based on false signals (which did not trigger Take Profit or the nearest target level), then all subsequent signals from this level should be ignored.
3) In a flat, any pair can form a lot of false signals or not form them at all. But in any case, at the first signs of a flat, it is better to stop trading.
4) Trade deals are opened in the time period between the beginning of the European session and until the middle of the American one, when all deals must be closed manually.
5) On the 30-minute TF, using signals from the MACD indicator, you can trade only if there is good volatility and a trend, which is confirmed by a trend line or a trend channel.
6) If two levels are located too close to each other (from 5 to 15 points), then they should be considered as an area of support or resistance.
On the chart:
Support and Resistance Levels are the Levels that serve as targets when buying or selling the pair. You can place Take Profit near these levels.
Red lines are the channels or trend lines that display the current trend and show in which direction it is better to trade now.
The MACD indicator (14,22,3) consists of a histogram and a signal line. When they cross, this is a signal to enter the market. It is recommended to use this indicator in combination with trend lines (channels and trend lines).
Important speeches and reports (always contained in the news calendar) can greatly influence the movement of a currency pair. Therefore, during their exit, it is recommended to trade as carefully as possible or exit the market in order to avoid a sharp price reversal against the previous movement.
Beginners on Forex should remember that not every single trade has to be profitable. The development of a clear strategy and money management are the key to success in trading over a long period of time.


