empty
18.07.2022 05:07 PM
GBP/USD analysis on July 18. The pound can complicate the already complex wave marking

This image is no longer relevant

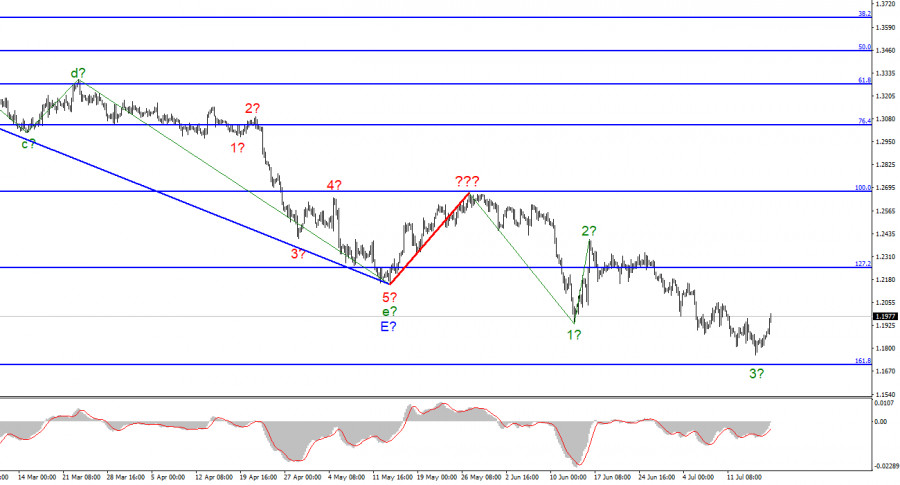
The wave marking for the pound/dollar instrument required clarifications, which were made. The upward wave constructed between May 13 and May 27 does not currently fit into the overall wave picture, but it can still be regarded as a segment of the downward trend. Thus, we can now definitively state that the building of the upward correction phase of the trend has been canceled, and the downward component of the trend will have a longer and more complex shape. I am not a huge fan of continually complicating the wave marking when dealing with a trend zone that is significantly elongating. I believe it would be far more efficient to recognize rare corrective waves, following which new impulse structures could be constructed. Now that waves 1 and 2 have been completed, we may infer that the instrument is in the process of constructing wave 3. However, this wave proved unconvincing (if finished now), as its low is not significantly lower than wave 1's low. Consequently, the current downturn cannot be characterized as impulsive, but it may be a complex correction. Focus on the wave marking of the EUR/USD instrument in this regard.

The pound no longer knows what it desires.

In July, the pound and dollar exchange rate jumped by 150 basis points. This is excellent news for the British, whose demand has been progressively falling over the past few months. I leave unanswered the question of why there was such an increase in the value of the British pound on Monday when no significant event occurred. The wave marking did not indicate a significant increase, as the third wave is not yet complete. However, the pound decided to confound everyone and everything. Initially, the instrument did not want to construct a logical trend correction section; now, it does not want to construct a logical trend impulse declining part. Thus, you must anticipate that the wave marking will get increasingly complex on multiple occasions. The market is currently anticipating two significant central bank meetings. Future meetings are crucial since both may include surprises. Over the past two weeks, the likelihood of a 100-basis-point rate hike by the Federal Reserve has slowly climbed as the inflation report has once again disappointed American analysts and lawmakers. Currently, this chance is less than 25 percent, but some FOMC members still support a 100-point tightening. Therefore, this possibility cannot be ruled out entirely.

Additionally, the Bank of England may provide a surprise. It raised interest rates five times in a row, although this had no effect on inflation in the United Kingdom. On Wednesday, a new report will be revealed; if the consumer price index rises more than anticipated, the Bank of England may decide to take drastic action and raise the interest rate by 50 basis points. This situation may lead to a rise in demand for the pound sterling, given all previous gains were deemed insufficient by the market.

General conclusions

The increased complexity of the wave structure of the pound/dollar pair signals a further downturn. For each "down" MACD signal, I recommend selling the instrument with objectives at the estimated mark of 1.1708, corresponding to 161.8 percent Fibonacci. Now, there is a prospect of an upward wave forming, but I do not anticipate it to be robust and protracted.

This image is no longer relevant

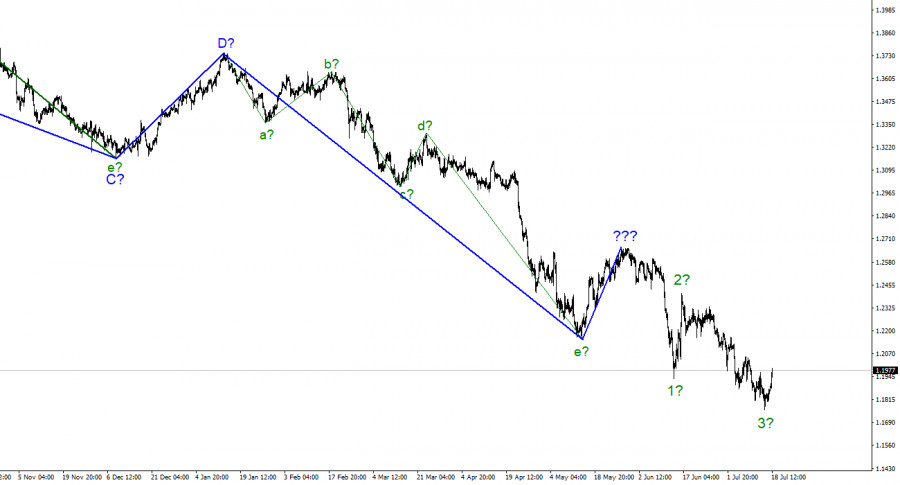
At the higher wave scale, the image closely resembles the euro/dollar instrument. The same ascending wave does not fit the present wave pattern, followed by the same three descending waves. Thus, one thing is unmistakable: the downward segment of the trend continues to develop and can reach practically any length.

Chin Zhao,
انسٹافاریکس کا تجزیاتی ماہر
© 2007-2025
Summary
Urgency
Analytic
Alexander Dneprovskiy
Start trade
انسٹافاریکس کے ساتھ کرپٹو کرنسی کی معاملاتی تبدیلیوں سے کمائیں۔
میٹا ٹریڈر 4 ڈاؤن لوڈ کریں اور اپنی پہلی ٹریڈ کھولیں۔
  • Grand Choice
    Contest by
    InstaForex
    InstaForex always strives to help you
    fulfill your biggest dreams.
    مقابلہ میں شامل ہوں

تجویز کردہ مضامین

یورو / یو ایس ڈی تجزیہ برائے 31 جولائی 2025

یورو / یو ایس ڈی کے لیے 4 گھنٹے کے چارٹ پر لہر کا نمونہ کئی مہینوں سے بدستور برقرار ہے۔ رجحان کا اوپر کی طرف حصہ بننا جاری ہے،

Chin Zhao 21:10 2025-07-31 UTC+2

جی بی پی / یو ایس ڈی کا تجزیہ برائے 31 جولائی 2025

جی بی پی / یو ایس ڈی کے لیے لہر کا نمونہ تیزی کے تسلسل کی لہر کے ڈھانچے کی ترقی کی نشاندہی کرتا ہے۔ لہر کی ترتیب یورو

Chin Zhao 21:05 2025-07-31 UTC+2

جولائی 29 کو یورو / یو ایس ڈی: بلز مارکیٹ کو 1.189 کی سطح کی طرف دھکیل سکتے ہیں

طویل مدت میں، یورو / یو ایس ڈی مارکیٹ ایک بڑی تیزی کی اصلاح (بی) تشکیل دے رہی ہے، جو معیاری اے بی سی زگ زیگ کی شکل اختیار

Roman Onegin 19:06 2025-07-29 UTC+2

یورو / یو ایس ڈی کا تجزیہ برائے 17 جولائی 2025

یورو / یو ایس ڈی کے لیے 4 گھنٹے کے چارٹ پر لہر کا پیٹرن مسلسل کئی مہینوں سے غیر تبدیل شدہ ہے۔ اوپر کی طرف رجحان والے

Chin Zhao 21:57 2025-07-16 UTC+2

جولائی 16 2025 کو جی بی پی / یو ایس ڈی تجزیہ

جی بی پی / یو ایس ڈی کے لیے لہر کا پیٹرن بلش امپلس ویو پیٹرن کی تشکیل کی نشاندہی کرتا ہے۔ لہر کی ترتیب تقریباً یورو

Chin Zhao 21:53 2025-07-16 UTC+2

یورو / یو ایس ڈی کا تجزیہ برائے 30 جون 2025

یورو / یو ایس ڈی کے لیے 4 گھنٹے کے چارٹ پر لہر کا پیٹرن اوپر کی طرف رجحان والے حصے کی تشکیل کی نشاندہی کرتا ہے۔ 28 فروری تک،

Chin Zhao 20:17 2025-06-30 UTC+2

جی بی پی / یو ایس ڈی : تجزیہ اور پیشن گوئی

جی بی پی / یو ایس ڈی کے لیے لہر کا پیٹرن اوپر کی طرف آنے والی لہر کے پیٹرن کی تشکیل کی تجویز کرتا ہے۔ لہر کی تصویر تقریباً

Chin Zhao 20:14 2025-06-30 UTC+2

یورو / یو ایس ڈی کا تجزیہ برائے 23 جون 2025

یہ کہ 4 گھنٹے کے یورو / یو ایس ڈی چارٹ کا لہر پیٹرن اوپر کی طرف رجحان والے حصے کی ترقی کی نشاندہی کرتا ہے۔ یہ تبدیلی

Chin Zhao 19:35 2025-06-23 UTC+2

یورو / یو ایس ڈی کا تجزیہ برائے 18 جون 2025

یورو / یو ایس ڈی پئیر کے 4 گھنٹے کے چارٹ پر لہر کا پیٹرن تیزی کے رجحان والے حصے کی تشکیل کی نشاندہی کرتا ہے۔ یہ تبدیلی مکمل

Chin Zhao 20:02 2025-06-18 UTC+2

جون 16 2025 کو یورو / یو ایس ڈی تجزیہ

چار گھنٹے کے یورو / یو ایس ڈی چارٹ پر لہر کا پیٹرن اوپر کی طرف رجحان والے حصے کی ترقی کی نشاندہی کرتا ہے۔ یہ تبدیلی

Chin Zhao 20:07 2025-06-16 UTC+2
ابھی فوری بات نہیں کرسکتے ؟
اپنا سوال پوچھیں بذریعہ چیٹ.
Widget callback
 

Dear visitor,

Your IP address shows that you are currently located in the USA. If you are a resident of the United States, you are prohibited from using the services of InstaFintech Group including online trading, online transfers, deposit/withdrawal of funds, etc.

If you think you are seeing this message by mistake and your location is not the US, kindly proceed to the website. Otherwise, you must leave the website in order to comply with government restrictions.

Why does your IP address show your location as the USA?

  • - you are using a VPN provided by a hosting company based in the United States;
  • - your IP does not have proper WHOIS records;
  • - an error occurred in the WHOIS geolocation database.

Please confirm whether you are a US resident or not by clicking the relevant button below. If you choose the wrong option, being a US resident, you will not be able to open an account with InstaForex anyway.

We are sorry for any inconvenience caused by this message.