Analysis of EUR/USD on the 5-minute chart
On Wednesday, the euro/dollar pair launched a new downward cycle. By the end of the day, it approached the critical Kijun-sen line that is just 200 pips from its 20-year low. This once again proved that bulls are not strong enough to buy the asset. Yesterday, the euro/dollar pair dropped amid the eurozone inflation report for September that unveiled an acceleration to 9.9%. However, we suppose that traders were ready for such a result since it was the second estimate. Secondly, the faster-growing inflation means that the ECB will continue tightening its monetary policy. Thirdly, the euro started falling even before the publication of the report. Fourthly, there are a lot of factors that are still supporting the US dollar. Thus, the eurozone inflation report was not the only and the most important reason for the euro's depreciation. If the price declines below the critical line, the long-term downtrend is likely to revive.
On Wednesday, traders received good signals to enter the market. Two signals were formed near the Senkou Span B line. The pair upwardly broke this line, but then bounced. Traders should have taken into account both sell signals. Later, the price almost approached the Kijun-sen line, near which traders might close their orders. The profit was less than 50 pips.
COT report
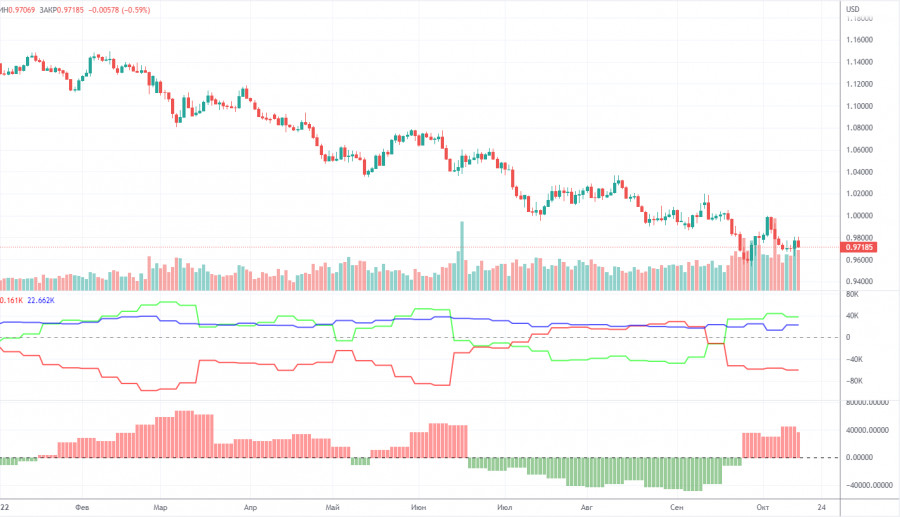
The euro COT reports for 2022 could be used as good examples. In the first part of the year, the reports were pointing to the bullish sentiment among professional traders. However, the euro was confidently losing value. Then, for several months, reports were reflecting bearish sentiment and the euro was also falling. Now, the net position of non-commercial traders is bullish again and the euro is still dropping. This could be explained by the high demand for the US dollar amid the difficult geopolitical situation in the world. Even if demand for the euro is rising, high demand for the greenback prevents the euro from growing. In the given period, the number of long non-commercial positions dropped by 3,200, whereas the number of short non-commercial positions jumped by 2,900. As a result, the net position declined by 6,100 contracts. However, this fact will hardly influence the market since the euro is still hovering near its multi-year lows. Now, professional traders still prefer the greenback. The number of long contracts exceeds the number of short contracts by 38,000. Thus, the net position of non-commercial traders may grow further without affecting the market. Although the total number of buy and sell positions is approximately the same, the euro continues falling. Thus, we need to wait for changes in the geopolitical and/or fundamental background to influence the foreign exchange market.
Analysis of EUR/USD on the one-hour chart
On the one-hour chart, the downtrend is still in force despite a significant rise during the recent week. However, the euro has already started falling and the long-term downtrend could be resumed at any moment. Fundamental and geopolitical data is still supporting the greenback. That is why the likelihood of a further decline is 80%. The pair will start the downward cycle from reaching new 20-year lows.
On Thursday, trading could be performed at the following levels: 0.9553, 0.9635, 0.9747, 0.9844, 0.9945, 1.0019, 1.0072 as well as the Senkou Span B (0.9834) and Kijun-sen (0.9752) lines. The lines of the Ichimoku indicator could move during the day. This should be taken into account when determining trading signals. There are also additional support and resistance levels, but trading signals are not formed near them.
Bounces and breakouts of the extreme levels and lines could act as signals. Don't forget about stop-loss orders, if the price covers 15 pips in the right direction. This will prevent you from losses in case of a false signal. On October 20, the US and the EU will not publish any important macroeconomic reports. The US unemployment claims data will hardly affect the market.
What we see on the trading charts:
Price levels of support and resistance are thick red lines, near which the movement may end. They do not provide trading signals.
The Kijun-sen and Senkou Span B lines are the lines of the Ichimoku indicator, moved to the one-hour chart from the 4-hour one. They are strong lines.
Extreme levels are thin red lines from which the price bounced earlier. They provide trading signals.
Yellow lines are trend lines, trend channels, and any other technical patterns.
Indicator 1 on the COT charts reflects the net position size of each category of traders.
Indicator 2 on the COT charts reflects the net position size for the non-commercial group.


