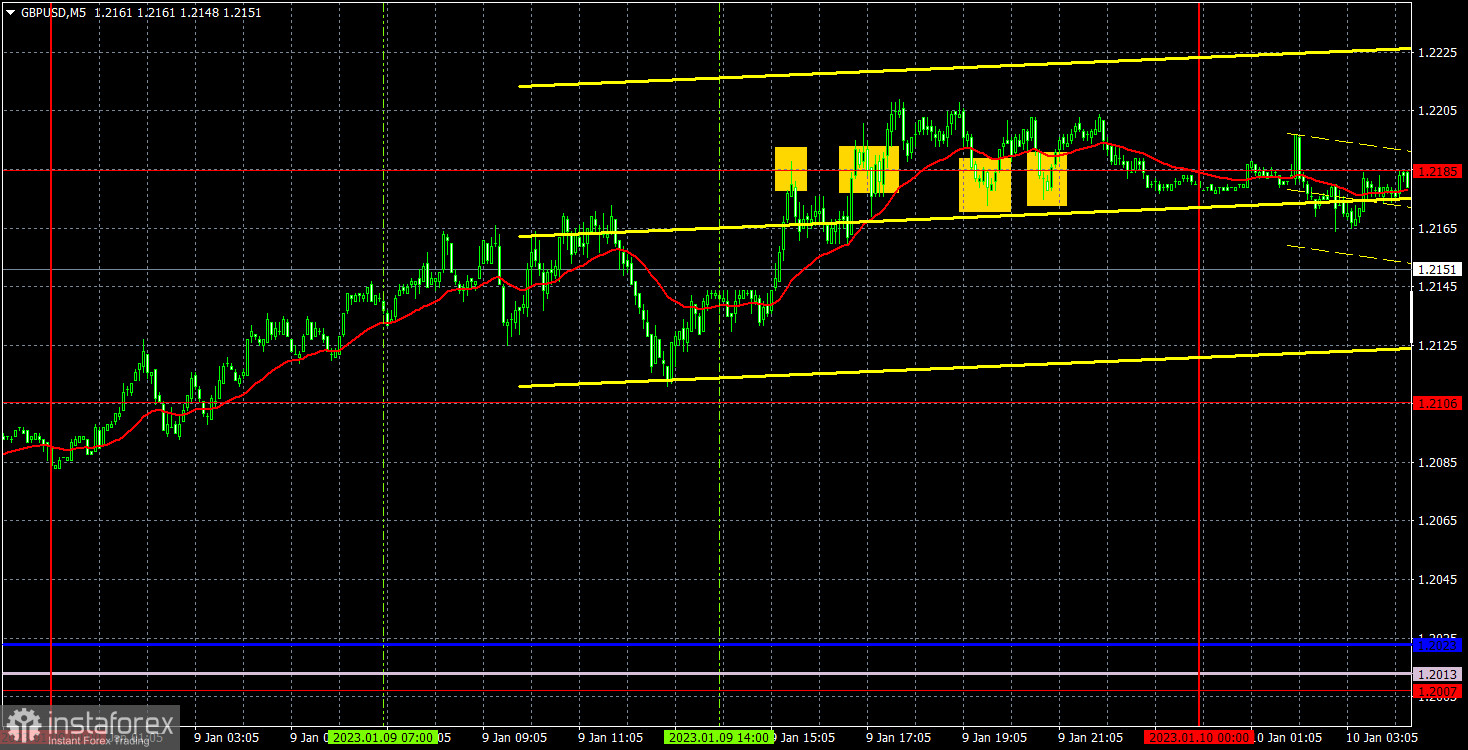
M5 chart of GBP/USD
On Monday, GBP/USD also tried to continue its upward movement for no reason. Several important macro data were released in the US on Friday, and traders only used them for one purpose - to buy the pound. Although in general, the data was in favor of the dollar because only one report out of the three turned out to be disappointing. In general, the market's reaction on Friday was absolutely illogical, and on Monday traders continued to buy the pair, though not as actively as before. Anyway, the pound rose again. After it rose 360 points in less than two days, it needs a new bearish correction. And beyond that, I believe that a more global correction has not yet ended. Therefore, I expect the pair to fall, which should start soon enough. Of course, if the market will consider the technical factors, instead of continuing to just buy, not paying attention to anything.
Monday's trading signals were very bad. All four signals were formed near 1.2185 during the US trading session. By that time, the upward momentum had already dried up, so all four signals were false. Traders were able to use only the first two of them, which resulted in small losses, as the price failed to move even 20 points in the right direction. Because of this, the last two signals should not have been triggered.
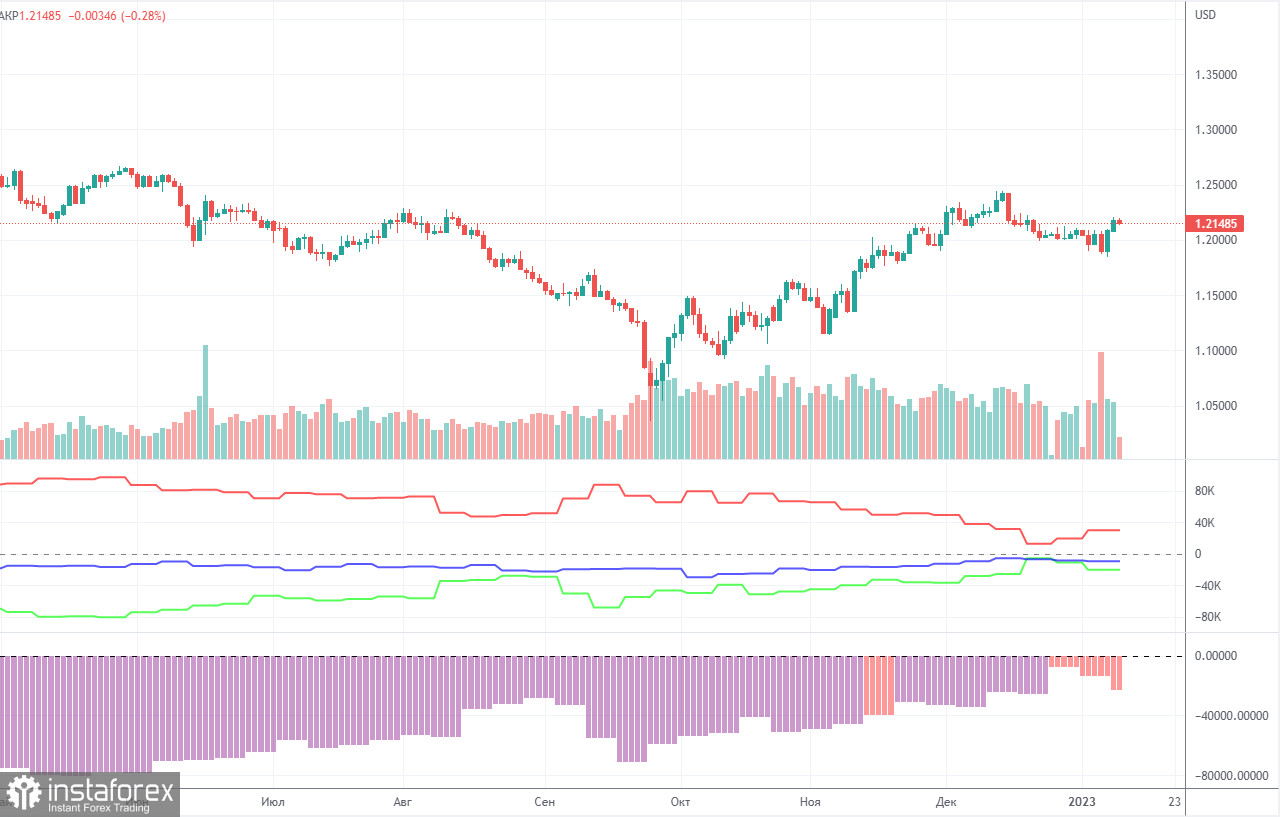
COT report
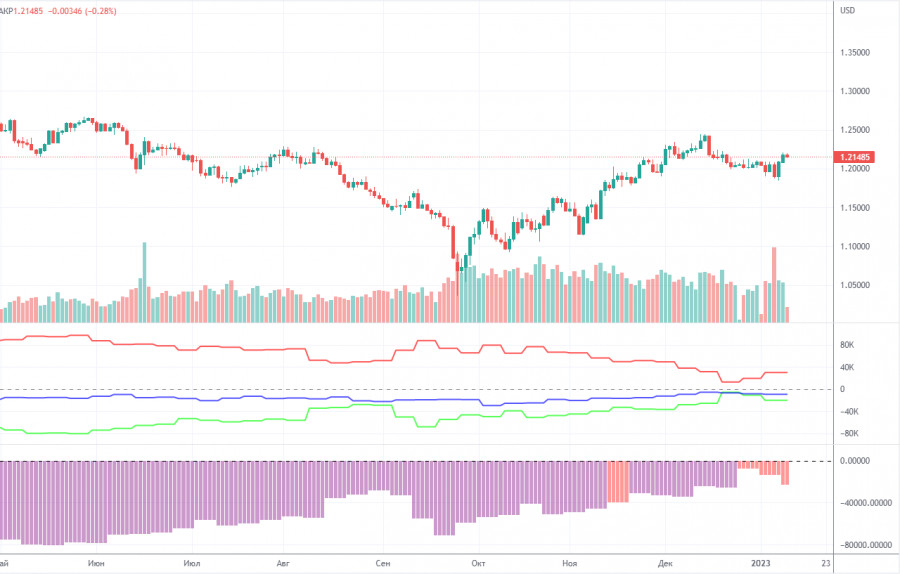
The latest COT report showed an increase in bearish sentiment. During the given period, non-commercial traders opened 3,000 long positions and as many as 12,400 short positions. Thus, the net position fell by about 9,400. This figure has been on the rise for several months, and the sentiment may become bullish in the near future, but it hasn't yet. Although the pound has grown against the dollar for the last few months, from a fundamental perspective, it is still difficult to answer why it keeps rising. On the other hand, it could fall in the near future (in the mid-term prospect) because it still needs a correction. In general, in recent months the COT reports correspond to the pound's movements so there shouldn't be any questions. Since the net position is not even bullish yet, traders may continue to buy the pair over the next few months. Non-commercial traders now hold 43,600,000 long positions and 63,900 short ones. I remain skeptical about the pound's long term growth, though there are technical reasons for it. At the same time, fundamental and geopolitical factors signal that the currency is unlikely to strengthen significantly.
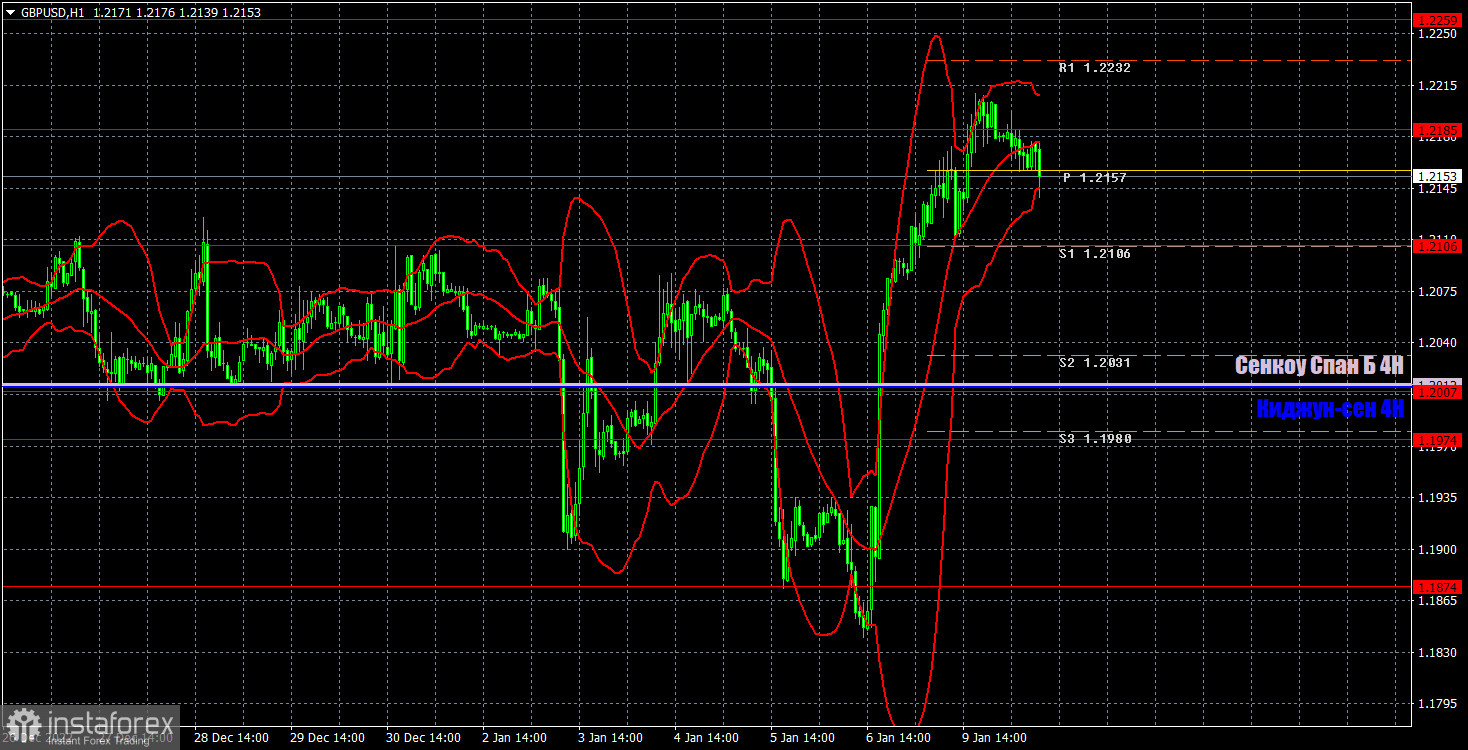
H1 chart of GBP/USD
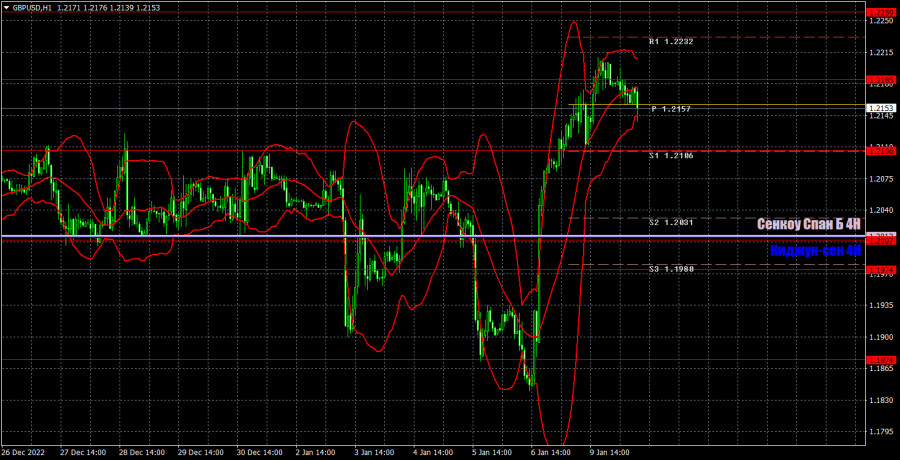
On the one-hour chart, GBP/USD sharply grew for the last two trading days, but why is the pound rising against the dollar? I don't think there are any reasons for it but at the same time the market is still more inclined to buy than to sell. The price is above the Ichimoku indicator lines, so growth is more likely for now, although I expect it to fall again. On January 10, the pair may trade at the following levels: 1.1760, 1.1874, 1.1974-1.2007, 1.2106, 1.2185, 1.2259, 1.2342, 1.2429-1.2458. The Senkou Span B (1.2012) and Kijun Sen (1.2012) lines may also generate signals. Pullbacks and breakouts through these lines may produce signals as well. A Stop Loss order should be set at the breakeven point after the price passes 20 pips in the right direction. Ichimoku indicator lines may move during the day, which should be taken into account when determining trading signals. In addition, the chart does illustrate support and resistance levels, which could be used to lock in profits. On Tuesday, there are no important events in the UK. On the other hand, Federal Reserve Chairman Jerome Powell's speech will be held in the US, which is always interesting. Traders might react to his speech, but it is important to take note of what exactly Powell will say and whether he mentions the Fed's monetary policy.
What we see on the trading charts:
Price levels of support and resistance are thick red lines, near which the movement may end. They do not provide trading signals.
The Kijun-sen and Senkou Span B lines are the lines of the Ichimoku indicator, moved to the one-hour chart from the 4-hour one. They are strong lines.
Extreme levels are thin red lines from which the price bounced earlier. They provide trading signals.
Yellow lines are trend lines, trend channels, and any other technical patterns.
Indicator 1 on the COT charts reflects the net position size of each category of traders.
Indicator 2 on the COT charts reflects the net position size for the non-commercial group.