empty
 
 
08.02.2023 11:18 AM
EUR/USD and GBP/USD trading plan for beginners on February 8, 2023

Details of the economic calendar on February 7

The macroeconomic calendar was empty. No important reports were released in the EU, the United Kingdom, and the Unites States.

In this regard, investors and traders focused on the incoming information and news flow. Federal Reserve Chairman Jerome Powell spoke before the Economic Club of Washington, where he once again pointed out the hawkish position of the regulator. However, the markets ignored Powell's words, perhaps due to the fact that all his statements were already known from the recent Fed meeting.

The main theses from Powell's speech:

- inflationary pressure is decreasing

- there is still a lot of work to be done

- interest rates need to be raised further

- national employment report was much stronger than expected

- monetary policy is still not sufficiently restrictive

- if the data continues to come out stronger than expected, the Fed will raise the rate even more

- 2% inflation target will not change

- inflation to fall significantly in 2023

- the labor market is strong because the economy is strong

- no decline in service sector inflation yet

- no decline in real estate inflation so far, expected in 2H 2023

- in order to fully reduce inflation, easing in the labor market is necessary

- if strong labor market reports or reports of higher inflation continue, the Fed may need to raise rates more than the markets are laying

- The Fed will respond to incoming statistics

This image is no longer relevant

Analysis of trading charts from February 7

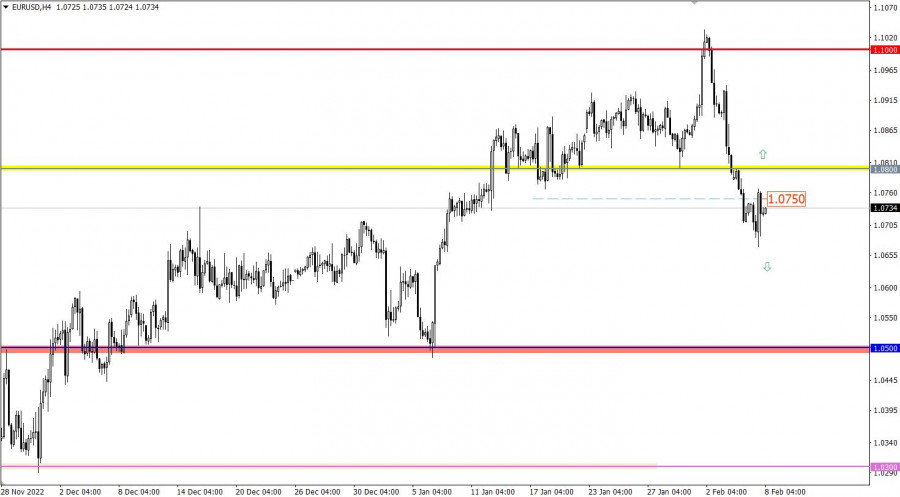
The EURUSD currency pair reached 1.0670 during the downward cycle, where there was a reduction in the volume of short positions. As a result, the market rebounded slightly above 1.0750, but this movement did not lead to anything cardinal. So far, all this reminds of the stagnation that arose at the stage of the downward cycle.

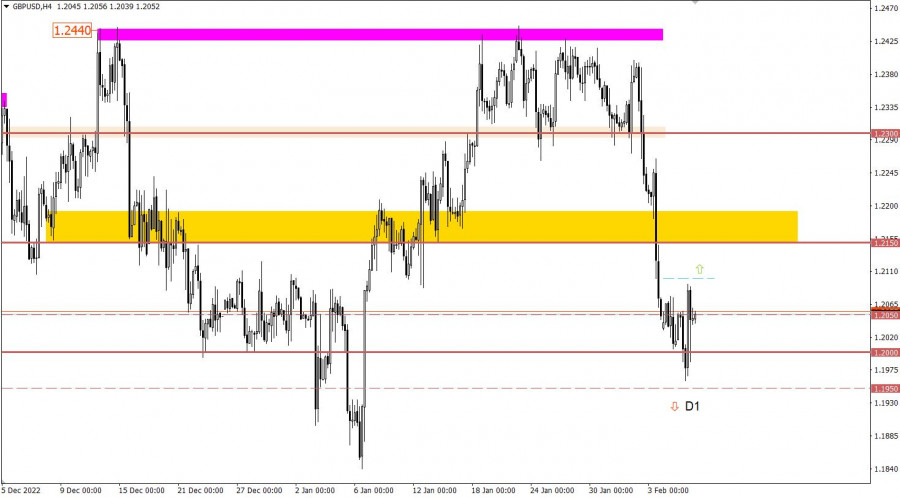
The GBPUSD currency pair, despite the manifestation of local activity, continued to move within the area of the 1.2000 psychological level. This price stagnation may well indicate a realignment of trading forces, which will eventually play into the hands of speculators.

Economic calendar for February 8

Today, the macroeconomic calendar is again empty. No important reports are expected in the EU, the United Kingdom, and the Unites States.

In this regard, investors and traders will continue to focus on the incoming information and news flow.

EUR/USD trading plan for February 8

Based on the euro's oversold status due to the strong price action the days before, the current stagnation-pullback is a justified move in the market. At the same time, the update of the correction low points to the continuing downward mood among traders in the market.

In this situation, the technical signal about the completion of the corrective move may be the price holding above the level of 1.0800 in a four-hour period.

As for the downward scenario, a prolonged corrective move may occur when the price holds below 1.0660.

This image is no longer relevant

GBP/USD trading plan for February 8

In this situation, special attention is paid to two values, these are 1.2100, where holding above it for at least a four-hour period may indicate the completion of a corrective move, and 1.1950, if the price holds below this value in the daily period, it may prolong the current downward cycle.

Until the above technical signals are confirmed, the market will continue to have variable turbulence along the 1.2000 psychological level.

This image is no longer relevant

What's on the charts

The candlestick chart type is white and black graphic rectangles with lines above and below. With a detailed analysis of each individual candle, you can see its characteristics relative to a particular time frame: opening price, closing price, intraday high and low.

Horizontal levels are price coordinates, relative to which a price may stop or reverse its trajectory. In the market, these levels are called support and resistance.

Circles and rectangles are highlighted examples where the price reversed in history. This color highlighting indicates horizontal lines that may put pressure on the asset's price in the future.

The up/down arrows are landmarks of the possible price direction in the future.

Gven Podolsky,
انسٹافاریکس کا تجزیاتی ماہر
© 2007-2024
انسٹافاریکس کے ساتھ کرپٹو کرنسی کی معاملاتی تبدیلیوں سے کمائیں۔
میٹا ٹریڈر 4 ڈاؤن لوڈ کریں اور اپنی پہلی ٹریڈ کھولیں۔
  • Grand Choice
    Contest by
    InstaForex
    InstaForex always strives to help you
    fulfill your biggest dreams.
    مقابلہ میں شامل ہوں
  • چانسی ڈیپازٹ
    اپنے اکاؤنٹ میں 3000 ڈالر جمع کروائیں اور حاصل کریں$6000 مزید!
    ہم دسمبر قرعہ اندازی کرتے ہیں $6000چانسی ڈیپازٹ نامی مقابلہ کے تحت
    اپنے اکاؤنٹ میں 3000 ڈالر جمع کروانے پر موقع حاصل کریں - اس شرط پر پورا اُترتے ہوئے اس مقابلہ میں شرکت کریں
    مقابلہ میں شامل ہوں
  • ٹریڈ وائز، ون ڈیوائس
    کم از کم 500 ڈالر کے ساتھ اپنے اکاؤنٹ کو ٹاپ اپ کریں، مقابلے کے لیے سائن اپ کریں، اور موبائل ڈیوائسز جیتنے کا موقع حاصل کریں۔
    مقابلہ میں شامل ہوں
  • 100 فیصد بونس
    اپنے ڈپازٹ پر 100 فیصد بونس حاصل کرنے کا آپ کا منفرد موقع
    بونس حاصل کریں
  • 55 فیصد بونس
    اپنے ہر ڈپازٹ پر 55 فیصد بونس کے لیے درخواست دیں
    بونس حاصل کریں
  • 30 فیصد بونس
    ہر بار جب آپ اپنا اکاؤنٹ ٹاپ اپ کریں تو 30 فیصد بونس حاصل کریں
    بونس حاصل کریں

تجویز کردہ مضامین

ابھی فوری بات نہیں کرسکتے ؟
اپنا سوال پوچھیں بذریعہ چیٹ.
Widget callback