empty
08.02.2023 04:44 PM
S&P 500 outlook for February 8, 2023

This image is no longer relevant

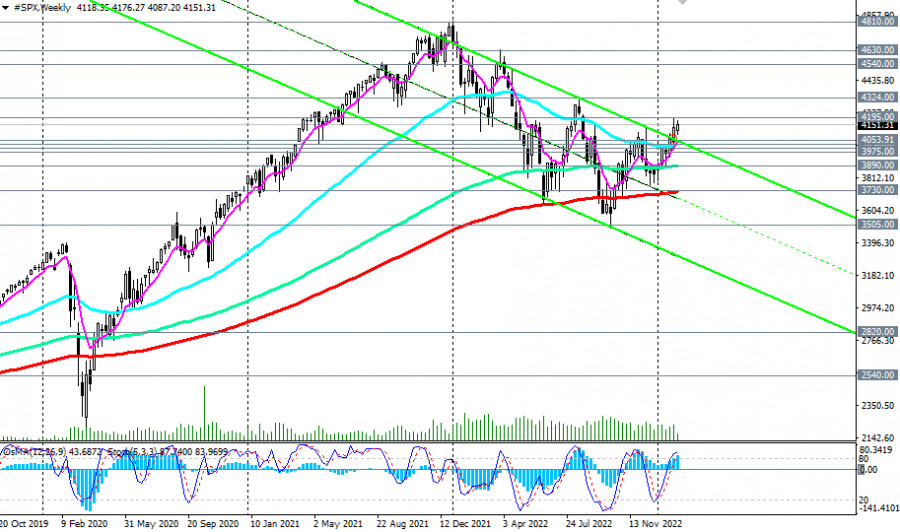
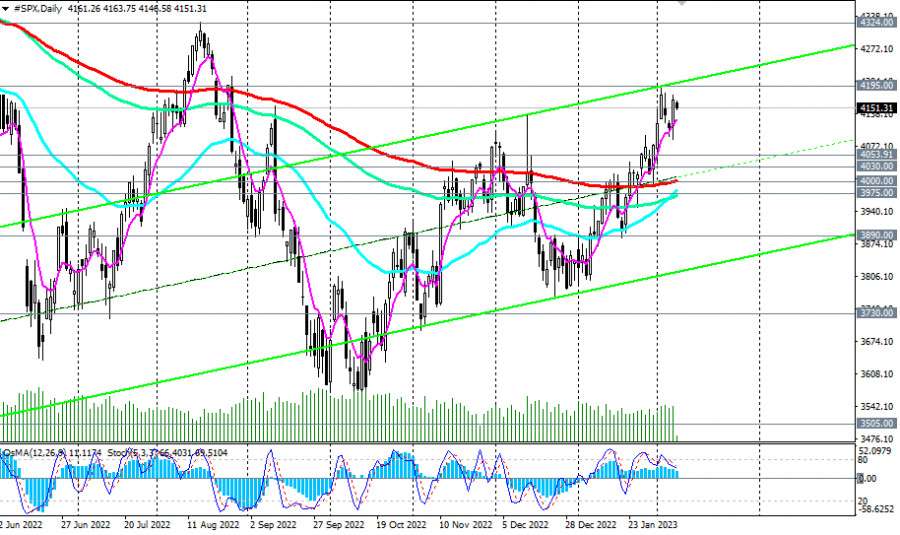
Futures on S&P 500 broad market index (reflected as CFD #SPX in the trading terminal) remain positive, trading in a bull market zone, above key support levels 4030.00 (50 EMA on the weekly chart), 4000.00 (200 EMA on the daily chart).

Despite the Fed's hawkish statements about the prospects for monetary policy, economists believe that it remains soft, given high inflation and a strong labor market. At the same time, high inflation contributes to the further depreciation of the dollar. In addition, the U.S. stock market seems to have turned upward again after the December Fed meeting, at which the rate was raised by 0.50% (and not by 0.75%, as it was in June, July, September, November) and Fed Chairman Jerome Powell noted that "the received data on inflation for October and November do indicate a long-awaited reduction in price pressure" although, in his opinion, "much more evidence is needed to be sure of a decrease in inflation."

After the December meeting, market participants began to bet on a further slowdown in the pace of the Fed's interest rate hike, and then on a pause and, possibly, the reverse process in the near future.

This image is no longer relevant

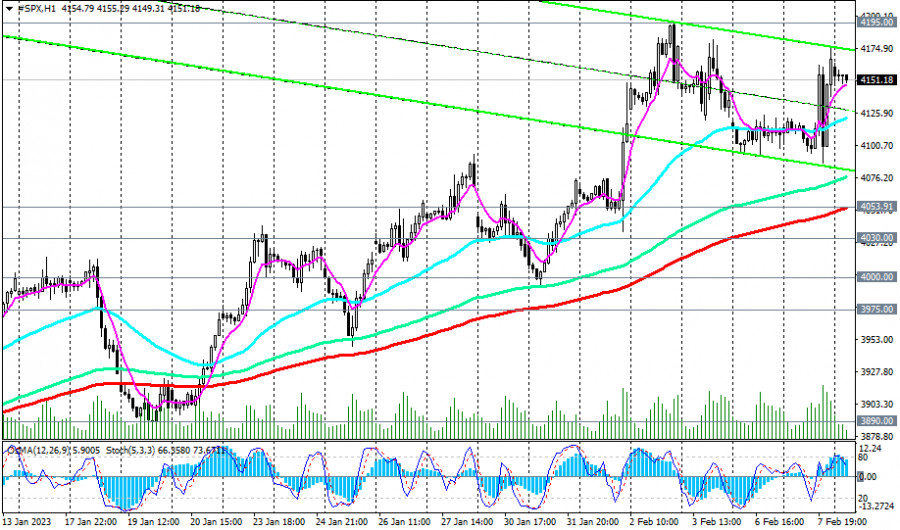
One way or another, the S&P500 futures are currently trading near 4150.00, in the zone of 6-month highs reached on February 2 near 4195.00. The breakout of this local resistance level will be additional evidence in favor of the revival of the global bullish trend of the S&P 500 and, perhaps, of the entire U.S. stock market.

Above the important short-term support at 4054.00 (200 EMA on the 1-hour chart), nothing threatens long positions.

This image is no longer relevant

But its breakdown will be the first signal for shorts trading on the S&P 500. The breakdown of the key support level 4000.00 (200 EMA on the daily chart), 3975.00 (144 EMA on the daily chart) will return the S&P 500 inside the downward channel on the weekly chart, sending the index to the key support level 3730.00 (200 EMA on the weekly chart).

However, only a breakdown of the strategic support levels 2820.00 (144 EMA on the monthly chart), 2540.00 (200 EMA on the monthly chart) will indicate the breaking of the long-term bullish trend of the S&P 500.

In general, the buy-and-hold strategy is still relevant for the U.S. stock market and its S&P 500 index.

Support levels: 4122.00 4085.00 4054.00 4030.00 4000.00 3975.00 3890.00 3800.00 3730.00 3700.00 3600.00 3500.00 2820.00 0.040

Resistance levels: 4195.00, 4324.00, 4540.00, 4630.00, 4810.00

Trading recommendations

Sell Stop 4085.00. Stop-Loss 4205.00. Whole 4054.00, 4030.00, 4000.00, 3975.00, 3890.00, 3800.00, 3730.00

Buy Stop 4205.00. Stop-Loss 4085.00. Whole 4300.00, 4320.00, 4400.00, 4500.00, 4600.00, 4700.0, 4800.00, 4900.00

Jurij Tolin,
انسٹافاریکس کا تجزیاتی ماہر
© 2007-2025
ٹائم فریم منتخب کریں
5
منٹ
15
منٹ
30
منٹ
1
گھنٹہ
4
گھنٹے
1
دن
1
ہفتہ
انسٹافاریکس کے ساتھ کرپٹو کرنسی کی معاملاتی تبدیلیوں سے کمائیں۔
میٹا ٹریڈر 4 ڈاؤن لوڈ کریں اور اپنی پہلی ٹریڈ کھولیں۔
  • Grand Choice
    Contest by
    InstaForex
    InstaForex always strives to help you
    fulfill your biggest dreams.
    مقابلہ میں شامل ہوں

تجویز کردہ مضامین

14 مئی کو یورو/امریکی ڈالر کے جوڑے کی تجارت کیسے کی جائے؟ نئے افراد کے لیے آسان تجاویز اور تجارتی تجزیہ

منگل کی تجارت کا تجزیہ یورو/امریکی ڈالر کا 1 گھنٹے کا چارٹ منگل کو، یورو/امریکی ڈالر کا کرنسی جوڑا پیر کی کمی سے تقریباً مکمل طور پر بحال ہو گیا۔

Paolo Greco 13:36 2025-05-14 UTC+2

13 مئی کو برطانوی پاؤنڈ/امریکی ڈالر کے پیئر کی تجارت کیسے کی جائے؟ نئے افراد کے لیے آسان تجاویز اور تجارتی تجزیہ

پیر کی تجارت کا تجزیہ یورو/امریکی ڈالر کا 1 گھنٹے چارٹ کا تجزیہ پیر کے روز، برطانوی پاؤنڈ/امریکی ڈالر کا جوڑا بھی تیزی سے گر گیا، حالانکہ یہ کہنا زیادہ

Paolo Greco 13:35 2025-05-13 UTC+2

13 مئی کو یورو/امریکی ڈالر کے جوڑے کی تجارت کیسے کی جائے؟ نئے افراد کے لیے آسان تجاویز اور تجارتی تجزیہ

پیر کی تجارت کا تجزیہ یورو/امریکی ڈالر کا 1 گھنٹے کے چارٹ کا تجزیہ پیر کو، یورو/امریکی ڈالر کی کرنسی کا جوڑا ڈوب گیا۔ تاجر غالباً اس خیال کے عادی

Paolo Greco 13:34 2025-05-13 UTC+2

13 مئی کو برطانوی پاؤنڈ/امریکی ڈالر کے لیے تجارتی سفارشات اور تجزیہ: ایک اچانک موڑ

برطانوی پاؤنڈ/امریکی ڈالر کا 5 منٹ کا تجزیہ پیر کے روز، برطانوی پاؤنڈ/امریکی ڈالر کی کرنسی کے جوڑے میں نمایاں کمی واقع ہوئی، جس کی وجہ چین اور امریکہ

Paolo Greco 13:34 2025-05-13 UTC+2

13 مئی کو یورو/امریکی ڈالر کے لیے تجارتی سفارشات اور تجزیہ: غیر متوقع ابتدا

یورو/امریکی ڈالر کا 5 منٹ کا تجزیہ یورو/امریکی ڈالر کی کرنسی کے جوڑے نے پیر کو مضبوط نیچے کی حرکت دکھائی، جو کافی عرصے سے نہیں ہوئی۔ تاہم، امریکی ڈالر

Paolo Greco 13:33 2025-05-13 UTC+2

12 مئی کو برطانوی پاؤنڈ/امریکی ڈالر کے پیئر کی تجارت کیسے کی جائے؟ نئے افراد کے لیے آسان تجاویز اور تجارتی تجزیہ

جمعہ کی تجارت کا تجزیہ برطانوی پاؤنڈ/امریکی ڈالر کا 1 گھنٹے کا چارٹ جمعہ کو، برطانوی پاؤنڈ/امریکی ڈالر کی کرنسی کے جوڑے نے بڑھنے کا رجحان ظاہر کیا۔ جیسا

Paolo Greco 13:54 2025-05-12 UTC+2

12 مئی کو یورو/امریکی ڈالر کے جوڑے کی تجارت کیسے کی جائے؟ نئے افراد کے لیے آسان تجاویز اور تجارتی تجزیہ

جمعرات کی تجارت کا تجزیہ یورو/امریکی ڈالر کا 1 گھنٹے چارٹ کا تجزیہ جمعہ کو، یورو/امریکی ڈالرکی کرنسی کے جوڑے نے کافی تکنیکی اور متوقع انداز میں تجارت کی۔ امریکی

Paolo Greco 13:53 2025-05-12 UTC+2

12 مئی کو برطانوی پاؤنڈ/امریکی ڈالر کے لیے تجارتی سفارشات اور تجزیہ۔ فلیٹ رجحان ختم نہیں ہوا

جمعہ کو، برطانوی پاؤنڈ/امریکی ڈالر کرنسی جوڑا ابتدائی طور پر اپنے سائیڈ وے چینل سے باہر نکلا لیکن تیزی اور اعتماد کے ساتھ سینکو اسپین بی لائن پر بحال

Paolo Greco 13:51 2025-05-12 UTC+2

12 مئی کو یورو/امریکی ڈالر کے لیے تجارتی سفارشات اور تجزیہ۔ یورو کو گرنے اور ڈالر کے بڑھنے کی کوئی جلدی نہیں ہے۔

یورو/امریکی ڈالر کا 5 منٹ کا تجزیہ یورو/امریکی ڈالر کی کرنسی کا جوڑا جمعہ کو اپنی نیچے کی حرکت جاری نہیں رکھ سکا۔ یہ حیران کن نہیں ہے، کیونکہ ڈالر

Paolo Greco 13:50 2025-05-12 UTC+2

یورو / یو ایس ڈی: 9 مئی کو ہونے والے امریکی سیشن کے لیے تجارتی منصوبہ (صبح کی تجارت کا جائزہ)

اپنی صبح کی پیشن گوئی میں، میں نے 1.1257 کی سطح کی طرف توجہ مبذول کرائی اور اس کے ارد گرد داخلے کے فیصلوں کی بنیاد رکھنے کا منصوبہ بنایا۔

Miroslaw Bawulski 20:05 2025-05-09 UTC+2
ابھی فوری بات نہیں کرسکتے ؟
اپنا سوال پوچھیں بذریعہ چیٹ.
Widget callback
 

Dear visitor,

Your IP address shows that you are currently located in the USA. If you are a resident of the United States, you are prohibited from using the services of InstaFintech Group including online trading, online transfers, deposit/withdrawal of funds, etc.

If you think you are seeing this message by mistake and your location is not the US, kindly proceed to the website. Otherwise, you must leave the website in order to comply with government restrictions.

Why does your IP address show your location as the USA?

  • - you are using a VPN provided by a hosting company based in the United States;
  • - your IP does not have proper WHOIS records;
  • - an error occurred in the WHOIS geolocation database.

Please confirm whether you are a US resident or not by clicking the relevant button below. If you choose the wrong option, being a US resident, you will not be able to open an account with InstaForex anyway.

We are sorry for any inconvenience caused by this message.