Analysis of EUR/USD on 5M
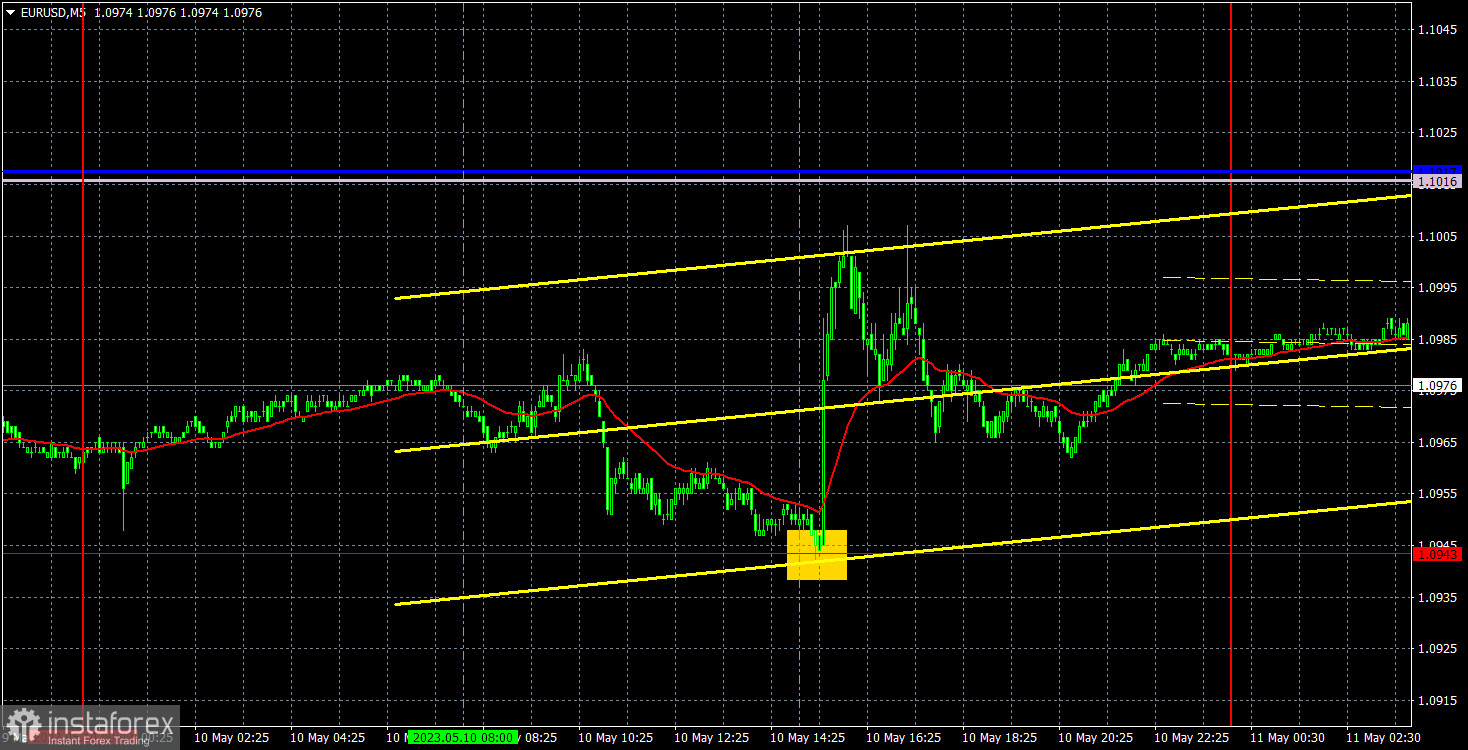
The euro/dollar pair has been sliding for the third day in a row in the first half of the day. Yesterday, in the second part of the day, after the publication of the US inflation report, it soared. On the chart above, the movement at the beginning of the American trading session looks powerful, but in fact, it was about 60 pips. We have already mentioned that volatility has significantly decreased in recent weeks, which is another problem for traders. The first problem is the flat movement that has been seen in the market for three weeks. Therefore, trading is now extremely inconvenient.
Returning to the inflation report, the data turned out to be extremely neutral and even met the forecast. The consumer price index slowed down by only 0.1%, which should not have caused any reaction. However, the 1.0943 level is an approximate lower limit of the sideways channel. That is why we saw a rebound and a considerable rise within the sideways channel.
Yesterday, only one trading signal was formed. That is a rebound from the level of 1.0943. Traders did not have the opportunity to use this signal, although it was quite good. The fact is that at the moment of its formation, the pair had already risen by 30 pips. Taking into account the current volatility, it is quite a lot. In addition, opening a trade exactly at the time of publishing one of the most important reports is not the best idea. If the trade had already been opened at the time of publication and a Stop Loss at breakeven had been set, then it would have been possible to stay in the market.
COT report
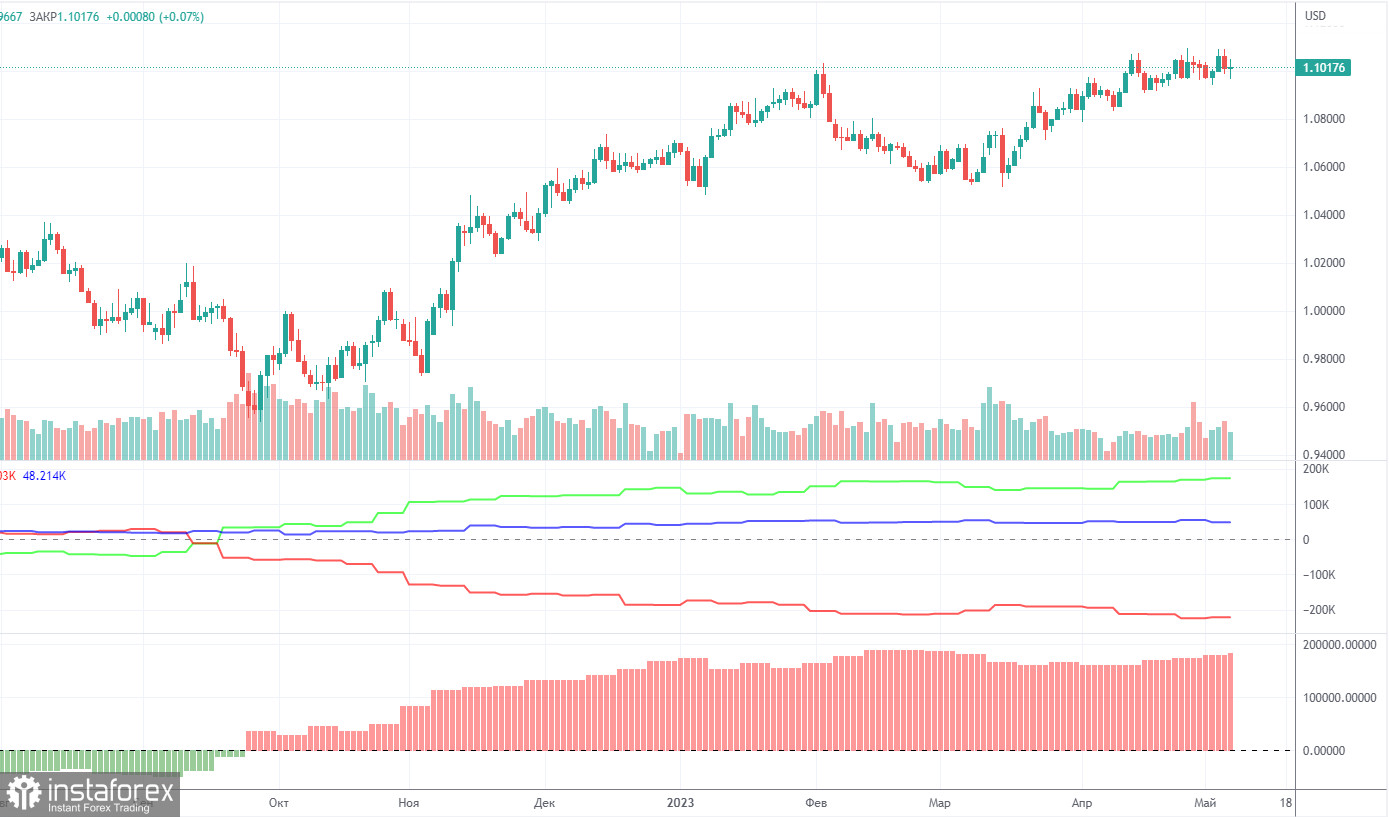
On Friday, a new COT report was released for May 2nd. Over the past 8-9 months, the data from COT reports has been fully corresponding to what is happening in the market. On the chart above, it is clear that the net position of large traders (the second indicator) started to grow in September 2022. Around the same time, the European currency also began to rise. Meanwhile, the net position of non-commercial traders remains bullish and very high like the position of the euro, which cannot even properly correct downwards.
We have already drawn traders' attention to the fact that a relatively high value of the net position may point to a soon end of the uptrend. The first indicator signals this as the red and green lines have moved far away from each other, which often precedes the end of a trend. The euro tried to start falling but it just inched down. During the last reporting week, the number of buy contracts for the non-commercial group increased by 3.3 thousand, and the number of shorts decreased by 0.7 thousand. Accordingly, the net position advanced again by 4 thousand contracts. The number of BUY contracts is higher than the number of SELL contracts for non-commercial traders by 174 thousand, which is a lot. The difference is almost threefold. The correction is still overdue. Thus, even without COT reports, it is clear that the pair should start falling. However, it continues gaining in value.
Analysis of EUR/USD on 1H.
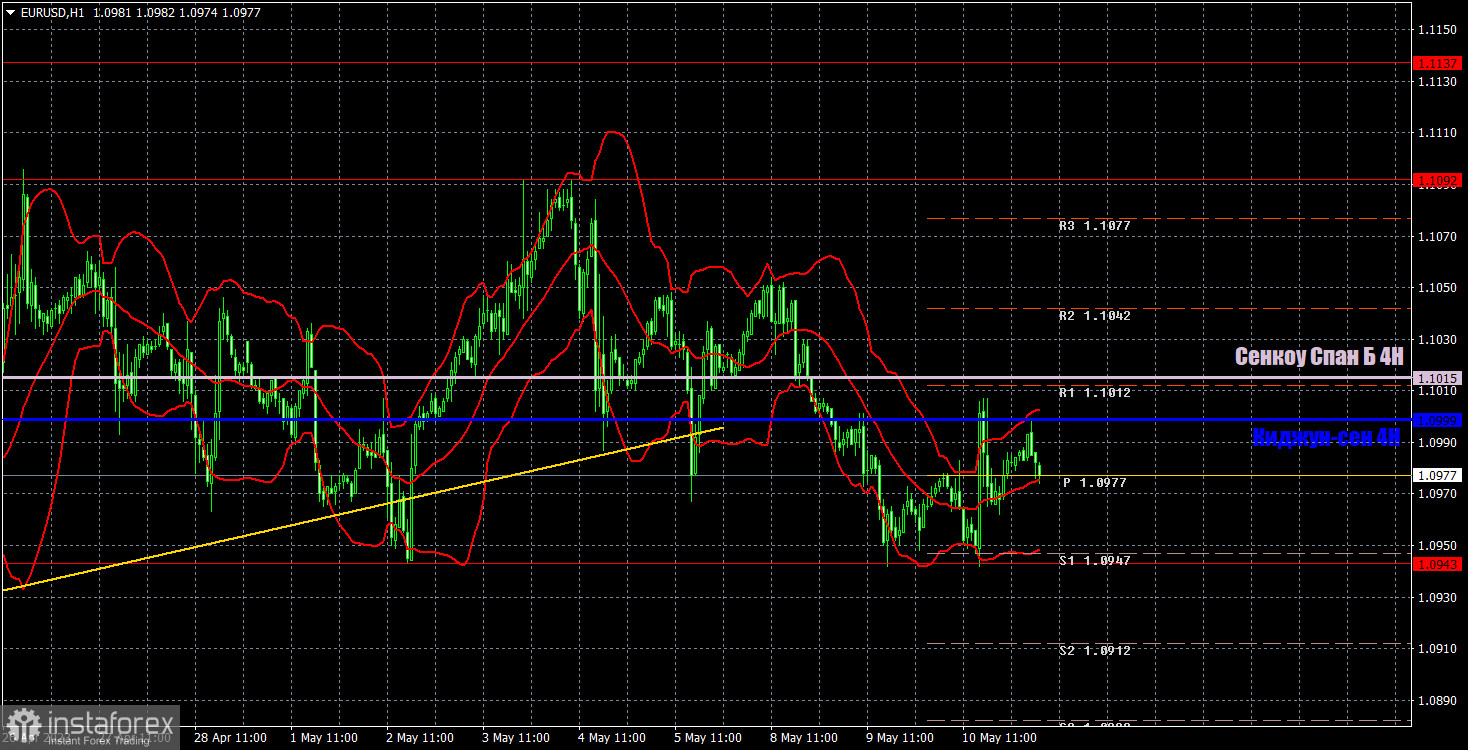
On the hourly timeframe, the pair continues showing strange and unclear movements, which can be clearly seen on the chart above. Essentially, we are now observing a movement within a sideways channel. The Ichimoku indicator lines are weak, and false signals may form around them. The euro is still too high, overbought, and cannot show a correction. We continue to advocate for the pair's decline.
On Thursday, we highlight the following trading levels: 1.0762, 1.0806, 1.0868, 1.0943, 1.1092, 1.1137-1.1185, 1.1234, 1.1274, as well as the Senkou Span B (1.1015) and Kijun-sen (1.0999) lines. The Ichimoku indicator lines may move during the day, which should be taken into account when determining trading signals. There are also support and resistance levels, but no signals are formed around them. Do not forget to place a Stop Loss order at breakeven if the price moves in the correct direction by 15 pips. This will protect against possible losses if the signal turns out to be false.
On May 11, Isabel Schnabel and Luis de Guindos from the ECB will deliver speeches. In the United States, secondary reports on producer prices and unemployment claims will be published. The Bank of England meeting is the key event of the day, which may also affect the European currency.
What we see on the trading charts:
Price levels of support and resistance are thick red lines, near which the movement may end. They do not provide trading signals.
The Kijun-sen and Senkou Span B lines are the lines of the Ichimoku indicator, moved to the one-hour chart from the 4-hour one. They are strong lines.
Extreme levels are thin red lines from which the price bounced earlier. They provide trading signals.
Yellow lines are trend lines, trend channels, and any other technical patterns.
Indicator 1 on the COT charts reflects the net position size of each category of traders.
Indicator 2 on the COT charts reflects the net position size for the non-commercial group.