empty
12.05.2023 11:26 AM
EUR/USD and GBP/USD trading plan for beginners on May 12, 2023

Details of the economic calendar on May 11

The Bank of England, following the Federal Reserve and the European Central Bank, has indeed raised the rate by 25 basis points to 4.5%, although 2 board members voted for a pause.

According to the regulator, the trajectory of demand will be "significantly stronger" than previously assumed. Inflation in the first quarter was "above expectations" due to an "unexpected" rise in goods and food prices.

The Bank of England believes that over a 2–3 year horizon, inflation will fall to 1%–2% primarily due to a natural process, although it is ready for additional rate hikes. However, a further rate increase to 5% seems unlikely. Overall, the meeting's results were as expected, but the pound sterling still began to fall.

Analysis of trading charts from May 11

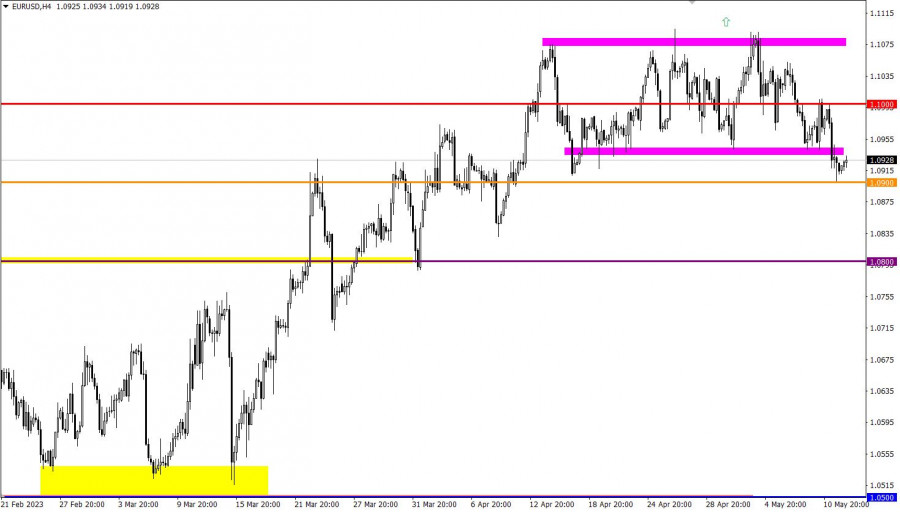
During the intense downward movement, EUR/USD reached the level of 1.0900, which led to a reduction in short positions volume. As a result, there was a stagnation and a pullback from this level.

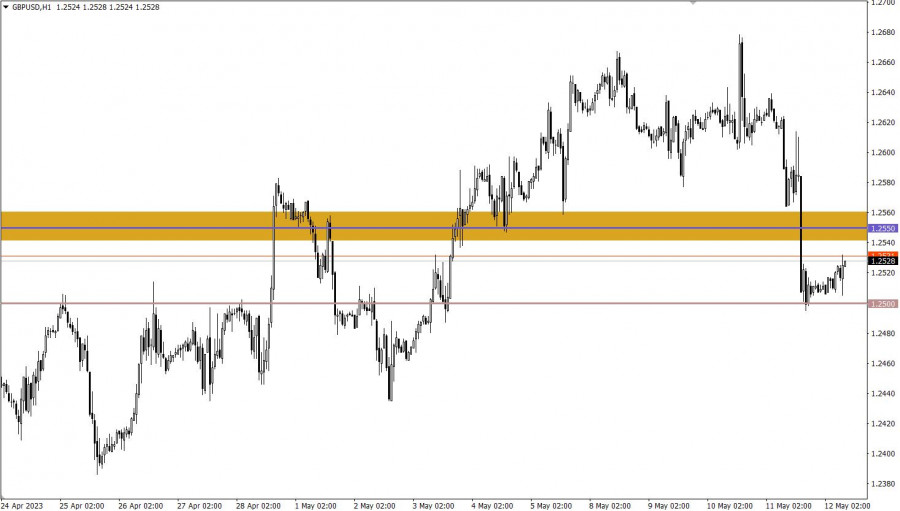
GBP/USD lost about 100 points in the course of inertial movement. The significant price change not only led to the breakdown of 1.2550, but also a drop in the quote to 1.2500. Subsequent fluctuations were characterized by stagnation, which was due to a technical signal of the British currency being oversold.

This image is no longer relevant

Economic calendar for May 12

With the opening of the European session, the first estimate of UK GDP for the first quarter was published, which was lower than forecasts, indicating a slowdown in economic growth from 0.6% to 0.2%. It was expected that economic growth would slow down to 0.3%, which increases the risk of recession.

EUR/USD trading plan for May 12

In this situation, traders are considering the possibility of forming a pullback, which will eventually lead to the return of the Euro to its previous price range. However, if the pullback turns out to be false and the quote stays below the 1.0900 level in the daily period, it may signal the emergence of a full-fledged correction in the structure of the upward trend.

This image is no longer relevant

GBP/USD trading plan for May 12

In this situation, to continue the downward cycle, the quote needs to stay below the 1.2500 level for at least a four-hour period. Until that point, traders will consider a pullback scenario, within which the quote could easily rise above 1.2550.

This image is no longer relevant

What's on the charts

The candlestick chart type is white and black graphic rectangles with lines above and below. With a detailed analysis of each individual candle, you can see its characteristics relative to a particular time frame: opening price, closing price, intraday high and low.

Horizontal levels are price coordinates, relative to which a price may stop or reverse its trajectory. In the market, these levels are called support and resistance.

Circles and rectangles are highlighted examples where the price reversed in history. This color highlighting indicates horizontal lines that may put pressure on the asset's price in the future.

The up/down arrows are landmarks of the possible price direction in the future.

Gven Podolsky,
انسٹافاریکس کا تجزیاتی ماہر
© 2007-2025
ٹائم فریم منتخب کریں
5
منٹ
15
منٹ
30
منٹ
1
گھنٹہ
4
گھنٹے
1
دن
1
ہفتہ
انسٹافاریکس کے ساتھ کرپٹو کرنسی کی معاملاتی تبدیلیوں سے کمائیں۔
میٹا ٹریڈر 4 ڈاؤن لوڈ کریں اور اپنی پہلی ٹریڈ کھولیں۔
  • Grand Choice
    Contest by
    InstaForex
    InstaForex always strives to help you
    fulfill your biggest dreams.
    مقابلہ میں شامل ہوں

تجویز کردہ مضامین

12 جون کو برطانوی پاؤنڈ/امریکی ڈالر کے پیئر کی تجارت کیسے کی جائے؟ نئے افراد کے لیے آسان تجاویز اور تجارتی تجزیہ

بدھ کی تجارت کا تجزیہ برطانوی پاؤنڈ/امریکی ڈالر کا 1گھنٹے کا چارٹ بدھ کو، برطانوی پاؤنڈ/امریکی ڈالر کا جوڑا یورو/امریکی ڈالر کے جوڑے کی طرح منتقل ہوا۔ امریکی افراط

Paolo Greco 14:09 2025-06-12 UTC+2

12 جون کو یورو/امریکی ڈالر کے جوڑے کی تجارت کیسے کی جائے؟ نئے افراد کے لیے آسان تجاویز اور تجارتی تجزیہ

بدھ کی تجارت کا تجزیہ یورو/امریکی ڈالر کا 1گھنٹے کا چارٹ بدھ کے روز، یورو/امریکی ڈالر کی کرنسی کے جوڑے نے اپنے اوپر کی طرف رجحان دوبارہ شروع کیا،

Paolo Greco 14:08 2025-06-12 UTC+2

12 جون کو برطانوی پاؤنڈ/امریکی ڈالر کے لیے تجارتی سفارشات اور تجزیہ: پاؤنڈ کو خوش کرنے کی ایک نئی وجہ مل گئی

برطانوی پاؤنڈ/امریکی ڈالر کا 5 منٹ کا تجزیہ بدھ کو، برطانوی پاؤنڈ/امریکی ڈالر کی کرنسی کے جوڑے نے اپنی اوپر کی حرکت دوبارہ شروع کی۔ جیسا کہ پہلے

Paolo Greco 14:05 2025-06-12 UTC+2

12 جون کو یورو/امریکی ڈالر کے لیے تجارتی سفارشات اور تجزیہ: یہاں تک کہ افراط زر نے بھی ڈالر کو خوش نہیں کیا

یورو/امریکی ڈالر کا 5 منٹ کا تجزیہ یورو/امریکی ڈالر کرنسی کے جوڑے نے بدھ کے دوران بہت مختلف طریقے سے تجارت کی۔ یورپی تجارتی سیشن کے دوران، جوڑی نے اپنی

Paolo Greco 14:02 2025-06-12 UTC+2

جی بی پی / یو ایس ڈی : 11 جون کو امریکی سیشن کے لیے تجارتی منصوبہ (صبح کی تجارت کا جائزہ)

اپنی صبح کی پیشن گوئی میں، میں نے 1.3483 کی سطح کی طرف توجہ مبذول کرائی اور اس کی بنیاد پر تجارتی فیصلے کرنے کا منصوبہ بنایا۔ آئیے

Miroslaw Bawulski 20:05 2025-06-11 UTC+2

11 جون کو برطانوی پاؤنڈ/امریکی ڈالر کے لیے تجارتی سفارشات اور تجزیہ: پاؤنڈ ایک نئے اضافے سے پہلے رک گیا

برطانوی پاؤنڈ/امریکی ڈالر کا 5 منٹ کا تجزیہ برطانوی پاؤنڈ/امریکی ڈالر کی کرنسی کی جوڑی نے منگل کے روز افراتفری کے ساتھ تجارت جاری رکھی لیکن مندی والے لہجے

Paolo Greco 16:21 2025-06-11 UTC+2

11 جون کو یورو/امریکی ڈالر کے لیے تجارتی سفارشات اور تجزیہ: بلندی پر فلیٹ موومنٹ

یورو/امریکی ڈالر کا 5 منٹ کا تجزیہ یورو/امریکی ڈالر کی کرنسی کا جوڑا منگل بھر میں دونوں سمتوں میں حرکت کرتا رہا۔ یہ حرکتیں فلیٹ مارکیٹ کی نشاندہی کرتی ہیں۔

Paolo Greco 16:17 2025-06-11 UTC+2

10 جون کو برطانوی پاؤنڈ/امریکی ڈالر کے لیے تجارتی سفارشات اور تجزیہ: پاؤنڈ کو گرنے کی کوئی جلدی نہیں ہے

برطانوی پاؤنڈ/امریکی ڈالر 5 منٹ کا تجزیہ پیر کو، برطانوی پاؤنڈ/امریکی ڈالر کرنسی کا جوڑا اپنی نیچے کی حرکت کو جاری رکھنے میں ممکنہ طور پر ناکام رہا۔ یاد کریں

Paolo Greco 13:43 2025-06-10 UTC+2

10 جون کو یورو/امریکی ڈالر کے لیے تجارتی سفارشات اور تجزیہ: ایک اور دن، منفی کی ایک اور خوراک

یورو/امریکی ڈالر کا 5 منٹ کا تجزیہ یورو/امریکی ڈالر کرنسی کے جوڑے کی پیر بھر میں مخلوط تجارت ہوئی۔ ٹرینڈ لائن کو توڑنے کے باوجود، نیچے کی طرف حرکت (یعنی

Paolo Greco 13:42 2025-06-10 UTC+2
ابھی فوری بات نہیں کرسکتے ؟
اپنا سوال پوچھیں بذریعہ چیٹ.
Widget callback
 

Dear visitor,

Your IP address shows that you are currently located in the USA. If you are a resident of the United States, you are prohibited from using the services of InstaFintech Group including online trading, online transfers, deposit/withdrawal of funds, etc.

If you think you are seeing this message by mistake and your location is not the US, kindly proceed to the website. Otherwise, you must leave the website in order to comply with government restrictions.

Why does your IP address show your location as the USA?

  • - you are using a VPN provided by a hosting company based in the United States;
  • - your IP does not have proper WHOIS records;
  • - an error occurred in the WHOIS geolocation database.

Please confirm whether you are a US resident or not by clicking the relevant button below. If you choose the wrong option, being a US resident, you will not be able to open an account with InstaForex anyway.

We are sorry for any inconvenience caused by this message.