5M chart of GBP/USD
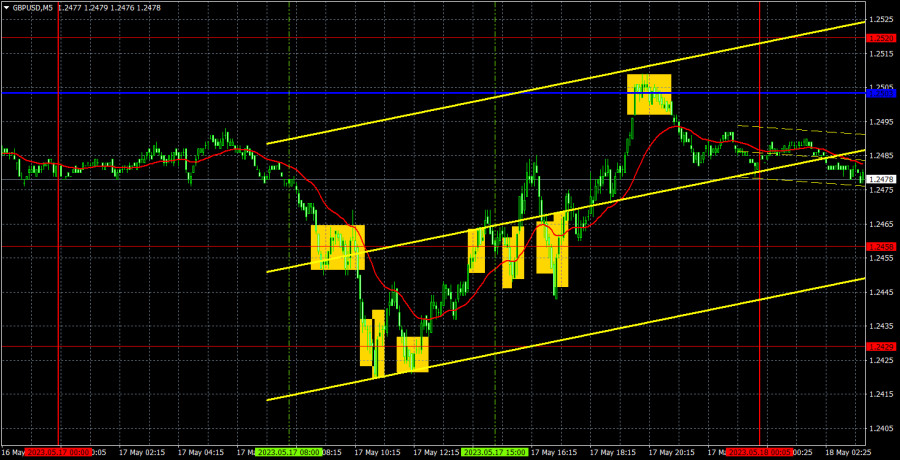
The GBP/USD pair traded higher on Wednesday, which was quite unfounded. The pound's decline on the higher chart is still quite conditional: the pair seems to be correcting, as if it's doing the market a favor. For example, there was a perfectly logical downward movement yesterday morning, but during the European trading session there was an upward reversal and the pound appreciated instead of falling. So why did the pair rise? Among the day's important events, we can single out the speech of Bank of England Governor Andrew Bailey. But then his stance wasn't exactly hawkish. In fact, he reiterated that he expects a strong slowdown in inflation for the rest of the year, as if hinting that the tightening of monetary policy is coming to an end... Therefore, the pound should have fallen rather than risen.
There were a whole bunch of trading signals on Wednesday. The pair ignored the levels on its way and constantly retreated. This is why it was quite difficult to trade. The first sell signal could be worked out - the pair overcame the 1.2458 level and dropped to 1.2429. It was necessary to close the shorts after consolidating above 1.2429 and the profit was 10 points a side (like the books had assumed). The buy signal could also be executed, and another one was formed half an hour later. At least two more sell signals were formed around the 1.2458 level, and they both turned out to be false. Therefore, the longs closed with a profit of another 10 points, and then there were two losing trades (Stop Loss on them could not be set). Despite the decent volatility, the pair traded in a chaotic manner.
COT report:
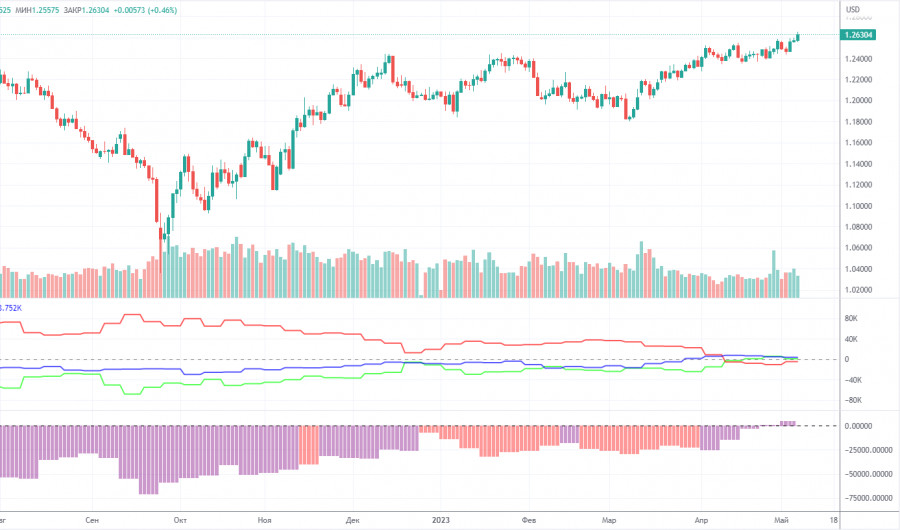
According to the latest report on the British pound, the non-commercial group opened 12,900 long positions and 9,500 short positions. Thus, the net position of non-commercial traders increased by 3,400 and continues to grow overall. The net position has been steadily rising for the past 8-9 months, but the sentiment of major market players remained bearish during this time. It has turned slightly bullish just recently. Although the British pound is strengthening against the US dollar in the medium term, it is hard to explain this behavior from the fundamental point of view. There is still the possibility of a sharp decline in the pound. Perhaps it has even already begun.
Both major pairs are moving in a similar way now, but the net position of the euro is positive and even implies the imminent completion of the upward momentum, while the net position of the pound still suggests further growth, as it is neutral. The British currency has risen by 2300 points, which is a lot, and without a strong bearish correction, the continuation of growth would be absolutely illogical (even if we ignore the lack of fundamental support). The non-commercial group has a total of 67,000 shorts and 71,500 longs. I remain skeptical about the long-term growth of the British currency and expect it to decline soon but the market sentiment remains largely bullish.
1H chart of GBP/USD
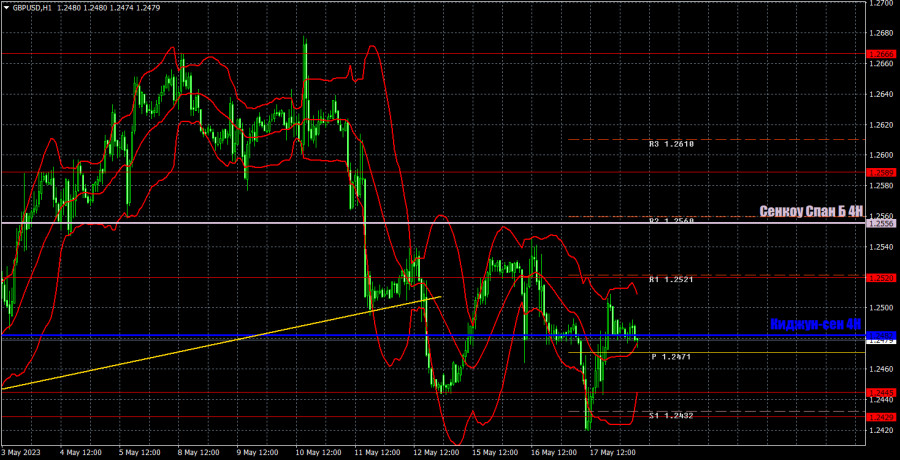
On the 1-hour chart, GBP/USD broke the ascending trend line last Friday, so technically, the pair should fall. However, recently, the pair hasn't been falling and has already crossed the critical line. I expect the overbought pound to fall, but after overcoming another ascending trend line, it shows no interest in falling again.
For May 18, we highlight the following important levels: 1.2349, 1.2429-1.2458, 1.2520, 1.2589, 1.2666. The Senkou Span B (1.2556) and Kijun-sen (1.2482) lines can also generate signals. Rebounds and breakouts from these lines can also serve as trading signals. It is better to set the Stop Loss at breakeven as soon as the price moves by 20 pips in the right direction. The lines of the Ichimoku indicator can change their position throughout the day which is worth keeping in mind when looking for trading signals. On the chart, you can also see support and resistance levels where you can take profit.
On Thursday, no important events are planned in the UK and the US. In America, a minor report on unemployment claims will be published, as well as another round of speeches from members of the Fed. Nothing super interesting and important.
Indicators on charts:
Resistance/support - thick red lines, near which the trend may stop. They do not make trading signals.
Kijun-sen and Senkou Span B are the Ichimoku indicator lines moved to the hourly timeframe from the 4-hour timeframe. They are also strong lines.
Extreme levels are thin red lines, from which the price used to bounce earlier. They can produce trading signals.
Yellow lines are trend lines, trend channels, and any other technical patterns.
Indicator 1 on the COT chart is the size of the net position of each trader category.
Indicator 2 on the COT chart is the size of the net position for the Non-commercial group of traders.


