empty
24.05.2023 06:49 AM
Fundamental analysis of EUR/USD on May 24, 2023. US negotiations on debt limit continue

This image is no longer relevant

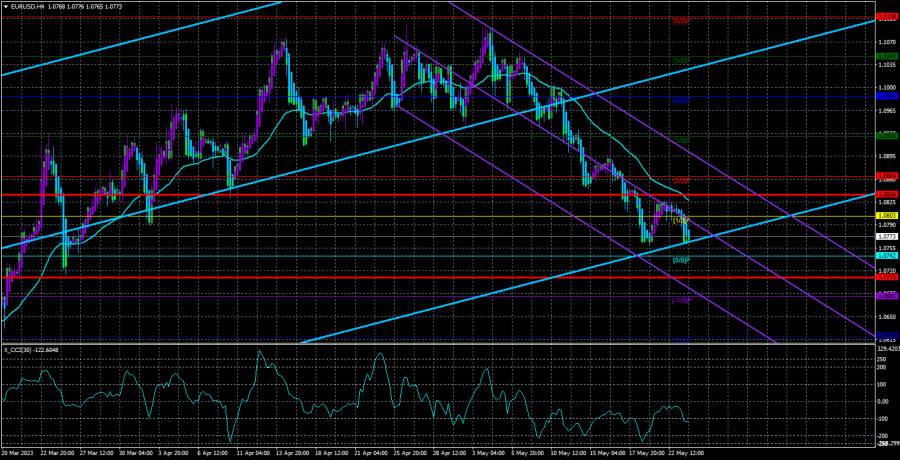
Tuesday was a calm trading day for EUR/USD. In the course of the day, the pair resumed the downtrend and entered a bullish correction. The price even approached the moving average, which was a sign of a strong bearish impulse. The pair shows a sluggish fall but does it almost every day. We see it drop by several hundred pips more. If quotes were declining fast, the CCI would already be in the oversold zone, and a buy signal would be generated.

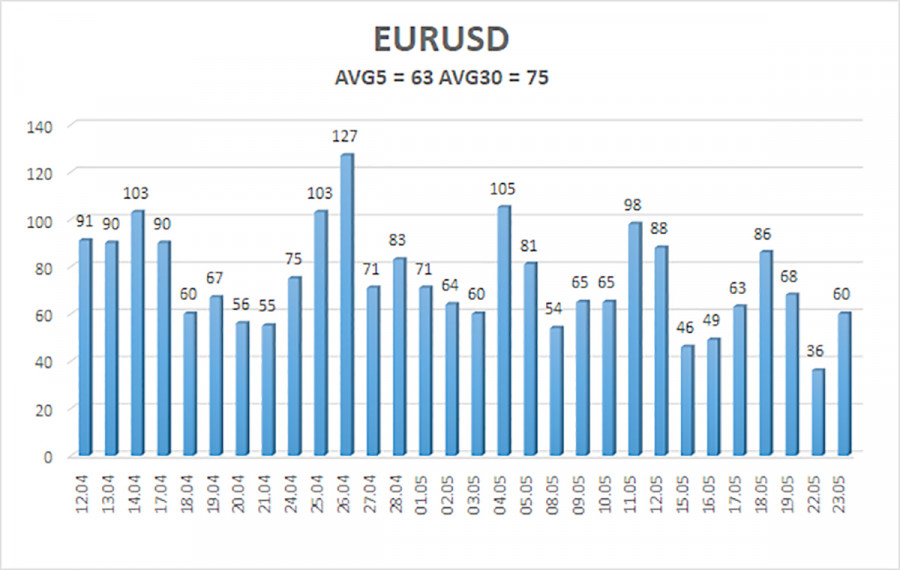
At the same time, it is hard to work with such a slow downward movement intraday. First, volatility has dropped sharply in recent months, which can be seen in the image below. When the pair goes by 50-60 pips a day, it gets almost impossible to assess profits. Second, in the 4-hour time frame, the Heiken Ashi reverses frequently due to occasional rebounds. Therefore, it is now better to trade in the medium term. Perhaps traders have their own tools for working with such a movement, but they should understand the very essence of it.

In the 24-hour time frame, the pair is still unable to break the Senkou Span B line, which makes us doubt a bearish continuation. Still, the pair has not bounced from this line yet. With this in mind, we may assume that this line will extend, as the bear trend has done in the past 2 weeks. All in all, the pair has limited growth potential for the coming weeks and even months.

Currently, all eyes are on negotiations on the debt ceiling in the US. At the same time, this event does not have any effect on either the pair or the greenback. After all, the US has to deal with this issue every year. Democrats and Republicans talk for weeks and finally reach an agreement. Neither party wants the country to default. Therefore, the market got used to this and no longer shows any reaction.

Likewise, the market stopped paying attention to US Treasury Secretary Janet Yellen who does everything to ease panic together with her colleague from the IMF, Kristalina Georgieva. Both claim that a default in the US will lead to a global economic disaster. Clearly, congressmen need to be pushed a little so that they do not relax. Moreover, it would be strange to hear Yellen talk about an imminent deal between the two American parties a week before the deadline.

On Tuesday, mixed data on business activity was delivered in the EU and the US. The manufacturing PMI decreased, and the one in the services sector advanced. The reports showed some influence on the market but volatility totaled 60 pips. Therefore, they were of little help to traders. As for regular speeches from Fed officials, the market got used to their mixed rhetoric. Some of those policymakers assume rates will be hiked again. Others believe that the tightening cycle will end in May. Therefore, this factor no longer has any impact on market sentiment.

This image is no longer relevant

The 5-day average volatility of EUR/USD totals 63 pips on May 24 and is considered moderate. We anticipate the price to be in the range between 1.0710 and 1.0836 on Wednesday. The Heiken Ashi's reversal to the upside will indicate a corrective move.

Support:

S1 – 1.0742

S2 – 1.0681

S3 – 1.0620

Resistance:

R1 – 1.0803

R2 – 1.0863

R3 – 1.0925

Outlook:

EUR/USD has resumed the downtrend. We will sell with targets at 1.0747 and 1.0742 before consolidation above the moving average. We will buy after consolidation above the MA, targeting 1.0925.

Indicators on charts:

Linear Regression Channels help identify the current trend. If both channels move in the same direction, a trend is strong.

Moving Average (20-day, smoothed) defines the short-term and current trends.

Murray levels are target levels for trends and corrections.

Volatility levels (red lines) reflect a possible price channel the pair is likely to trade in within the day based on the current volatility indicators.

CCI indicator. When the indicator is in the oversold zone (below 250) or in the overbought area (above 250), it means that a trend reversal is likely to occur soon.

Paolo Greco,
انسٹافاریکس کا تجزیاتی ماہر
© 2007-2025
ٹائم فریم منتخب کریں
5
منٹ
15
منٹ
30
منٹ
1
گھنٹہ
4
گھنٹے
1
دن
1
ہفتہ
انسٹافاریکس کے ساتھ کرپٹو کرنسی کی معاملاتی تبدیلیوں سے کمائیں۔
میٹا ٹریڈر 4 ڈاؤن لوڈ کریں اور اپنی پہلی ٹریڈ کھولیں۔
  • Grand Choice
    Contest by
    InstaForex
    InstaForex always strives to help you
    fulfill your biggest dreams.
    مقابلہ میں شامل ہوں

تجویز کردہ مضامین

ایکس اے یو / یو ایس ڈی : تجزیہ اور پیشن گوئی

امریکی صدر ڈونلڈ ٹرمپ کی جارحانہ تجارتی پالیسی اور عالمی معیشت پر اس کے اثرات کے بارے میں سرمایہ کاروں کی تشویش کے باعث سونے کی قیمت میں اضافہ جاری

Irina Yanina 13:39 2025-04-02 UTC+2

اے یو ڈی / یو ایس ڈی : تجزیہ اور پیشن گوئی

آج، اے یو ڈی / یو ایس ڈی پئیر مثبت رفتار دکھا رہا ہے، جو تقریباً چار ہفتے کی کم ترین سطح سے واپس لوٹ رہا ہے۔ ریزرو بینک

Irina Yanina 13:36 2025-04-02 UTC+2

2 اپریل کو کن چیزوں پر توجہ دی جائے؟ نئے تاجروں کے لیے بنیادی واقعات کی خرابی۔

بدھ کو بہت کم میکرو اکنامک ایونٹس ہوں گے، لیکن کل نے ہمیں دکھایا کہ میکرو رپورٹس کی ایک بڑی تعداد بھی ہمیشہ اہم حرکت کو متحرک نہیں کرتی

Paolo Greco 13:31 2025-04-02 UTC+2

برطانوی پاؤنڈ/امریکی ڈالر کی جوڑی کا جائزہ - 2 اپریل: پاؤنڈ ابھی تک اپنی جگہ پر پھنسا ہوا ہے۔

برطانوی پاؤنڈ/امریکی ڈالر کرنسی جوڑا ایک فلیٹ رینج میں تجارت جاری رکھے ہوئے ہے۔ 4 گھنٹے کے ٹائم فریم پر، یہ ایک کلاسک فلیٹ ہے۔ نچلے ٹائم فریم پر،

Paolo Greco 13:22 2025-04-02 UTC+2

یورو/امریکی ڈالر کے جوڑے کا جائزہ - 2 اپریل: ڈالر پھر سے بدقسمت ہو گیا۔

یورو/امریکی ڈالر کرنسی جوڑے نے منگل کو سستی اور ہچکچاہٹ کے ساتھ تجارت جاری رکھی۔ مارکیٹ نے ڈونلڈ ٹرمپ سے نئے ٹیرف کی توقع جاری رکھی، حالانکہ کل میکرو اکنامک

Paolo Greco 13:18 2025-04-02 UTC+2

بٹ کوائن بُلز کے جال میں پھنس گیا۔

باٹم کمزور ہے، اوپر کی کوئی خواہش نہیں ہے۔ یہاں تک کہ نام نہاد "سمارٹ پیسہ" بھی منفی عوامل کے سنگم کا حوالہ دیتے ہوئے، بٹ کوائن خریدنے

Marek Petkovich 16:28 2025-04-01 UTC+2

یو ایس ڈی / جے پی وائے : تجزیہ اور پیشن گوئی

آج، یو ایس ڈی / جے پی وائے پئیر ایک معمولی یومیہ اضآفہ کی تجارت سے فائدہ اٹھانے کے لیے کوشش کر رہا ہے، خاص طور پر ان توقعات

Irina Yanina 15:52 2025-04-01 UTC+2

امریکی سٹاک مارکیٹ: بری خبر مکمل قیمت میں

S&P 500 کی تین سالوں میں بدترین سہ ماہی تھی۔ سرمایہ کار سرمایہ شمالی امریکہ سے یورپ منتقل کر رہے ہیں۔ ایک بار عروج پر آنے والا

Marek Petkovich 11:56 2025-04-01 UTC+2

اپریل یورپ کے گیس کے مستقبل میں اہم کردار ادا کرے گا۔

یورپ کا گیس سیکٹر ایک نازک مرحلے میں داخل ہو رہا ہے، کیونکہ ہیٹنگ سیزن کے اختتام نے اسٹوریج کی سہولیات کو ری فلنگ کرنے کا مرحلہ طے کیا ہے،

Miroslaw Bawulski 16:49 2025-03-31 UTC+2

امریکی اسٹاک مارکیٹ مشکل حالات سے دوچار ہے

باہمی ٹیرف کے بارے میں افواہوں اور صارفین کے اعتماد کو ایک اور دھچکا اس سال ایس اینڈ پی 500 کی دوسری بدترین فروخت کو متحرک کرتا ہے۔ سرمایہ کاروں

Marek Petkovich 16:20 2025-03-31 UTC+2
ابھی فوری بات نہیں کرسکتے ؟
اپنا سوال پوچھیں بذریعہ چیٹ.
Widget callback
 

Dear visitor,

Your IP address shows that you are currently located in the USA. If you are a resident of the United States, you are prohibited from using the services of InstaFintech Group including online trading, online transfers, deposit/withdrawal of funds, etc.

If you think you are seeing this message by mistake and your location is not the US, kindly proceed to the website. Otherwise, you must leave the website in order to comply with government restrictions.

Why does your IP address show your location as the USA?

  • - you are using a VPN provided by a hosting company based in the United States;
  • - your IP does not have proper WHOIS records;
  • - an error occurred in the WHOIS geolocation database.

Please confirm whether you are a US resident or not by clicking the relevant button below. If you choose the wrong option, being a US resident, you will not be able to open an account with InstaForex anyway.

We are sorry for any inconvenience caused by this message.