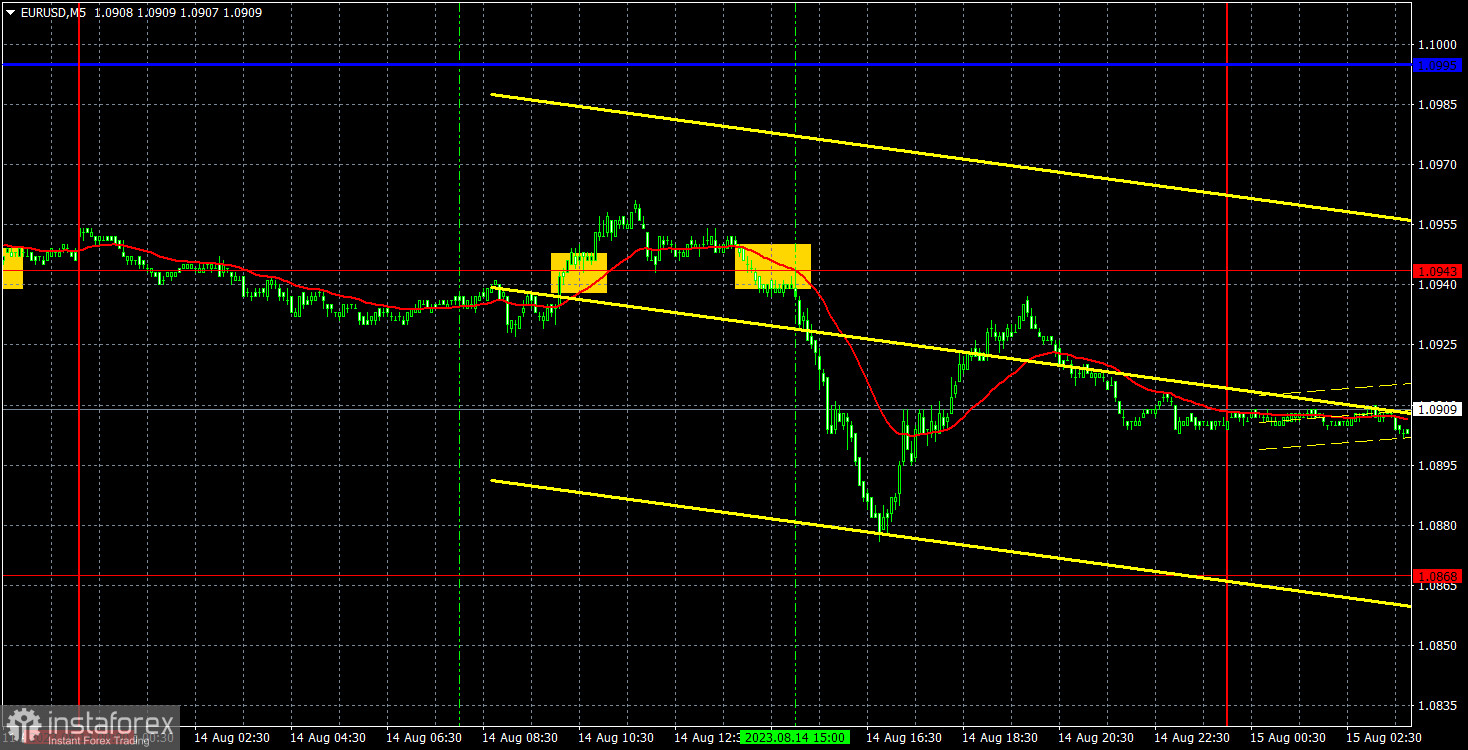
Analysis of EUR/USD 5M
On Monday, the EUR/USD pair accelerated its decline during the US session. However, during that same session, it managed to grow significantly, while during the European session, it traded flat. Yet, by the end of the day, the US dollar still advanced, even though there was a lack of macroeconomic and fundamental background for both the dollar and the euro. We expected to witness another "boring Monday", but the market decided otherwise. Volatility was 85 points, and the market was certainly not stagnant. Therefore, in the medium term, the pair continues to fall, which is fully in line with our expectations. The euro's decline might be gradual, but we see no reason for it to start an uptrend.
Speaking of trading signals, there were two. Initially, the pair settled above the 1.0943 level, but this signal turned out to be false, and the price failed to move even 15 points in the right direction. Therefore, the long position was closed at a slight loss when the second sell signal was formed. This time, the price almost reached the nearest target at 1.0868, and by the evening, it returned to the point of formation. Nonetheless, traders could have taken 15-20 points of profit, which at least had offset the loss from the first transaction.
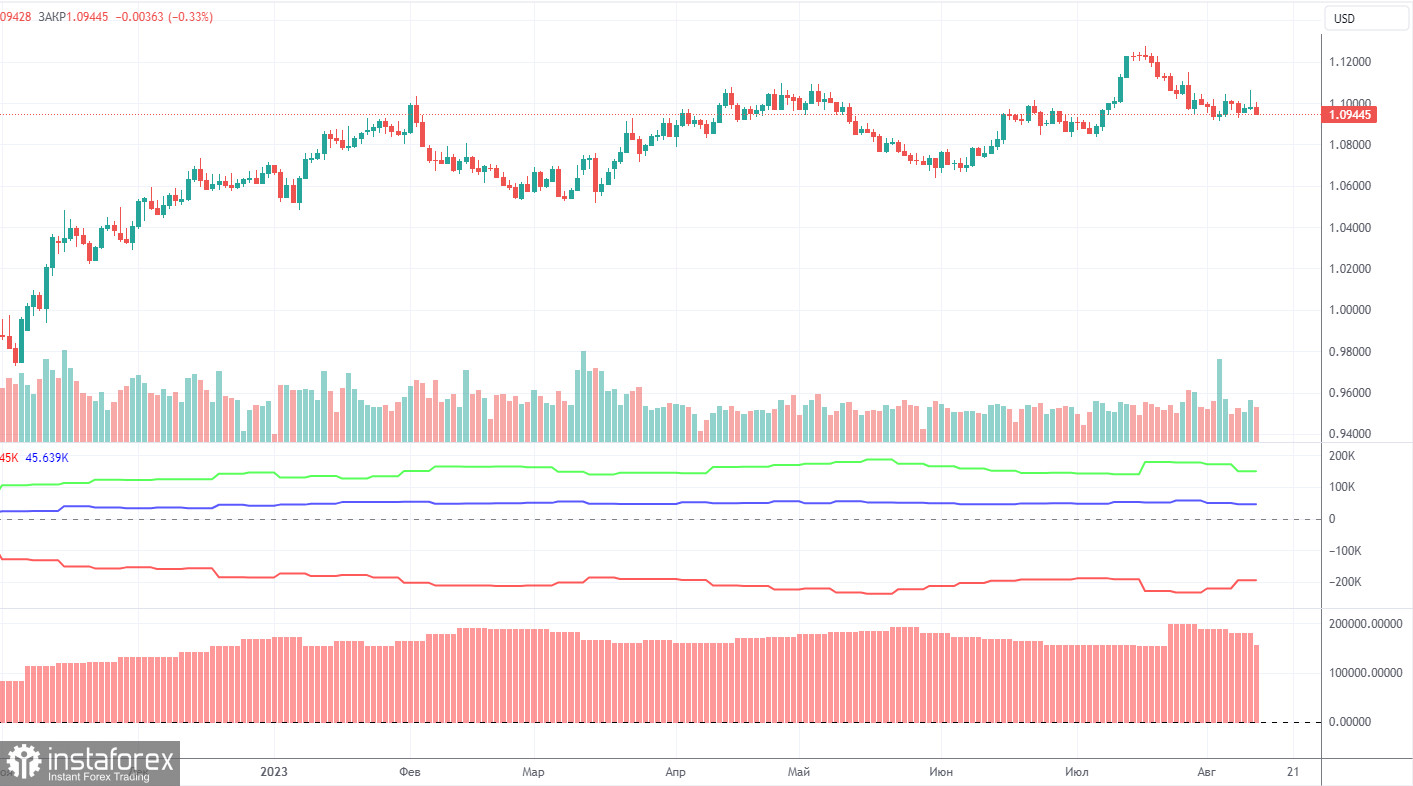
COT report:
On Friday, a new COT report for August 8 was released. In the last 11 months, COT reports fully corresponded to what is happening in the market. The chart above clearly shows that the net position of major traders (the second indicator) began to grow in September 2022 and at about the same time the euro started climbing too. In the last 6-7 months, the net position has not risen but the euro remains at very high levels. At the moment, the net position of non-commercial traders is bullish and remains strong. The euro keeps climbing against the US dollar.
I have already mentioned the fact that a fairly high value of the net position signals the end of an uptrend. This is also confirmed by the first indicator where the red and green lines are very far from each other. Usually, it precedes the end of the trend. During the last reporting week, the number of long positions of the non-commercial group of traders fell by 12,000 and the number of short ones increased by 10,200. The net position decreased by another 22,200 contracts. The number of long positions is higher than the number of short ones of non-commercial traders by 150,000. This is a very large gap as the difference is almost threefold. Even without COT reports, it is obvious that the euro should decline but speculators are still in no hurry to sell.
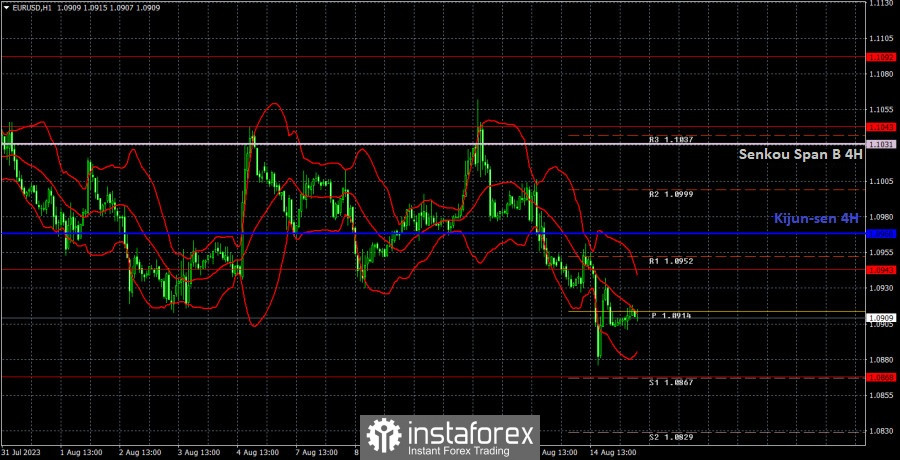
Analysis of EUR/USD 1H
On the 1H chart, the pair broke out of the sideways channel, where it had spent two weeks, but this does not mean that the downward movement will be strong and stable. There are quite a lot of macro data this week, so the euro might also receive some support from time to time. However, in general, we expect the pair to fall.
On August 15, traders should pay attention to the following key levels: 1.0762, 1.0806, 1.0868, 1.0943, 1.1043, 1.1092, 1.1137, 1.1185, 1.1274, as well as the Senkou Span B (1.1031) and Kijun-sen (1.0968) lines. The lines of the Ichimoku indicator can move during the day, which should be taken into account when determining trading signals. There are support and resistance levels that can be used to lock in profits. Traders look for signals at rebounds and breakouts. It is recommended to set the Stop Loss orders at the breakeven level when the price moves in the right direction by 15 pips. This will protect against possible losses if the signal turns out to be false.
Today, we can expect EU reports like the ZEW Economic sentiment index, which under certain circumstances might provoke a minor market reaction. The US will release its retail sales report, which can also cause a mild reaction. Plus, the pair traded quite actively yesterday, so we might see high volatility again.
Description of the chart:
Support and resistance levels are thick red lines near which the trend may end. They do not provide trading signals;
The Kijun-sen and Senkou Span B lines are the lines of the Ichimoku indicator, plotted to the 1H timeframe from the 4H one. They provide trading signals;
Extreme levels are thin red lines from which the price bounced earlier. They provide trading signals;
Yellow lines are trend lines, trend channels, and any other technical patterns;
Indicator 1 on the COT charts is the net position size for each category of traders;
Indicator 2 on the COT charts is the net position size for the Non-commercial group.