empty
 
 
08.09.2023 08:31 AM
Outlook for GBP/USD on September 8. COT report. The pound sterling sees no reason to rise

Analysis of GBP/USD 5M

This image is no longer relevant

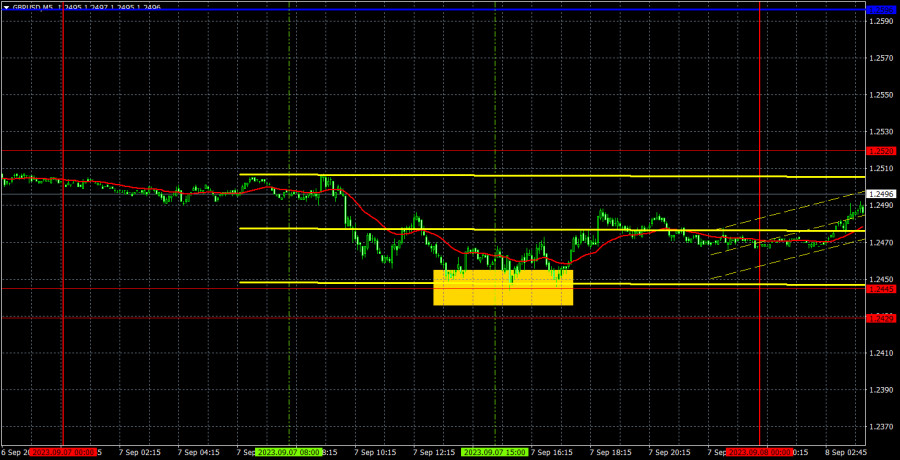
On Thursday, GBP/USD traded with low volatility and a slight bearish bias. It is not surprising that the pound continues to fall even in the absence of influential economic releases. We have repeatedly mentioned that the pound is overbought and unjustifiably pricey to remain at such high levels or even continue its uptrend. At the same time, it's no surprise that volatility was low on Thursday since the macroeconomic backdrop was virtually nonexistent. Fortunately, central bank meetings will start next week. Along with that, we can also expect several important reports that can help market participants determine their strategies for the following weeks.

Several buy signals were generated on Thursday, but they all duplicated each other. Therefore, traders could open a maximum of one long position when the price bounced off the level at 1.2445. This trade even managed to yield a profit of 10-15 pips. It was advisable to manually close this trade closer to the evening as there were no other signals.

COT report:

This image is no longer relevant

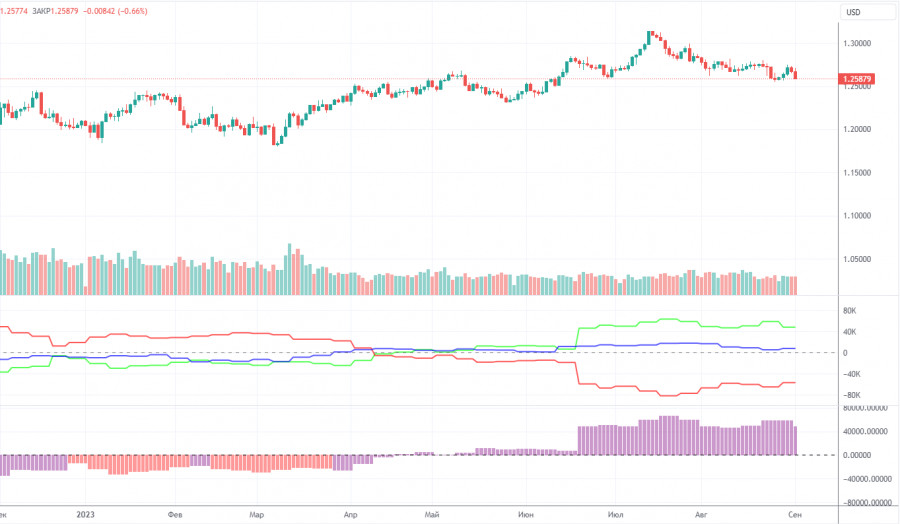
According to the latest report, the non-commercial group of traders closed 900 long positions and opened 9,800 short ones. Thus, the net position of non-commercial traders decreased by 10,700 positions in a week. The net position has been steadily growing over the past 11 months as well as the pound sterling. Now, the net position has advanced markedly. This is why the pair will hardly maintain its bullish momentum. I believe that a long and protracted downward movement should begin. COT reports signal a slight growth of the British currency but it will not be able to rise in the long term. There are no drivers for opening new long positions. Sell signals are starting to appear on the 4-hour and 24-hour charts.

The British currency has already grown by a total of 2,800 pips, from its absolute lows reached last year, which is a significant increase. Without a downward correction, the continuation of the uptrend will be illogical. We are not against the uptrend; we just believe a solid correction is needed first. The market perceives the fundamental background one-sidedly, ignoring any data in favor of the dollar. The Non-commercial group of traders has a total of 97,000 long positions and 48,700 short ones. I remain skeptical about the long-term growth of the pound sterling, and the market has recently started to pay more attention to selling.

Analysis of GBP/USD 1H

This image is no longer relevant

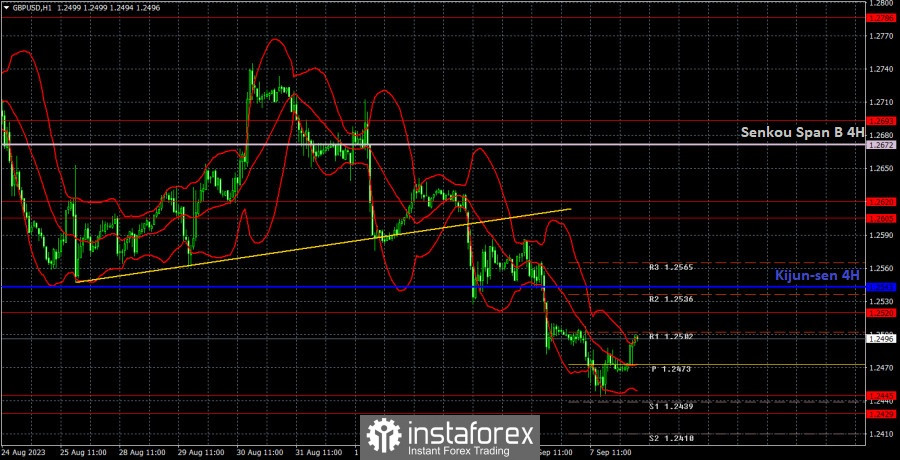
On the 1H chart, GBP/USD has settled below the ascending trendline, which shows that the pair may extend its downward movement. The price is also below the Ichimoku indicator lines. The downward movement can be somewhat erratic amid the weak fundamental background. The pound is expected to fall, but it is gradually doing so. Fortunately, the pair has plenty of time to do this.

On September 8, traders should pay attention to the following key levels: 1.2269, 1.2349, 1.2429-1.2445, 1.2520, 1.2605-1.2620, 1.2693, 1.2786, 1.2863. The Senkou Span B (1.2672) and Kijun-sen (1.2543) lines can also be sources of signals, e.g. rebounds and breakout of these levels and lines. It is recommended to set the Stop Loss orders at the breakeven level when the price moves in the right direction by 20 pips. The lines of the Ichimoku indicator can move during the day, which should be taken into account when determining trading signals. There are support and resistance levels that can be used to lock in profits.

On Thursday, there are no important reports or events lined up in the UK and the US. Therefore, we should brace ourselves for another low-volatility day, making it extremely difficult to earn anything.

Description of the chart:

Support and resistance levels are thick red lines near which the trend may end. They do not provide trading signals;

The Kijun-sen and Senkou Span B lines are the lines of the Ichimoku indicator, plotted to the 1H timeframe from the 4H one. They provide trading signals;

Extreme levels are thin red lines from which the price bounced earlier. They provide trading signals;

Yellow lines are trend lines, trend channels, and any other technical patterns;

Indicator 1 on the COT charts is the net position size for each category of traders;

Indicator 2 on the COT charts is the net position size for the Non-commercial group.

Paolo Greco,
انسٹافاریکس کا تجزیاتی ماہر
© 2007-2024
انسٹافاریکس کے ساتھ کرپٹو کرنسی کی معاملاتی تبدیلیوں سے کمائیں۔
میٹا ٹریڈر 4 ڈاؤن لوڈ کریں اور اپنی پہلی ٹریڈ کھولیں۔
  • Grand Choice
    Contest by
    InstaForex
    InstaForex always strives to help you
    fulfill your biggest dreams.
    مقابلہ میں شامل ہوں
  • چانسی ڈیپازٹ
    اپنے اکاؤنٹ میں 3000 ڈالر جمع کروائیں اور حاصل کریں$5000 مزید!
    ہم نومبر قرعہ اندازی کرتے ہیں $5000چانسی ڈیپازٹ نامی مقابلہ کے تحت
    اپنے اکاؤنٹ میں 3000 ڈالر جمع کروانے پر موقع حاصل کریں - اس شرط پر پورا اُترتے ہوئے اس مقابلہ میں شرکت کریں
    مقابلہ میں شامل ہوں
  • ٹریڈ وائز، ون ڈیوائس
    کم از کم 500 ڈالر کے ساتھ اپنے اکاؤنٹ کو ٹاپ اپ کریں، مقابلے کے لیے سائن اپ کریں، اور موبائل ڈیوائسز جیتنے کا موقع حاصل کریں۔
    مقابلہ میں شامل ہوں
  • 100 فیصد بونس
    اپنے ڈپازٹ پر 100 فیصد بونس حاصل کرنے کا آپ کا منفرد موقع
    بونس حاصل کریں
  • 55 فیصد بونس
    اپنے ہر ڈپازٹ پر 55 فیصد بونس کے لیے درخواست دیں
    بونس حاصل کریں
  • 30 فیصد بونس
    ہر بار جب آپ اپنا اکاؤنٹ ٹاپ اپ کریں تو 30 فیصد بونس حاصل کریں
    بونس حاصل کریں

تجویز کردہ مضامین

ابھی فوری بات نہیں کرسکتے ؟
اپنا سوال پوچھیں بذریعہ چیٹ.
Widget callback