The GBP/USD currency pair continues to trade very weakly in the local understanding of this word. As seen in the illustration below, the average volatility over the last five trading days is only 64 points, and the average volatility over the last 30 days is 77 points. But this is only due to earlier periods when volatility was higher. Thus, the market clearly shows no desire to trade actively.
In addition to this, the British pound continues to trade within a limited range. If previously it was a clearly defined flat with clear boundaries of a sideways channel, now there are no clear boundaries, but the pair has yet to start trading in a trending manner. We are observing a new upward movement phase, which can end anytime. After this, a new phase of the pair's decline will likely begin, as this is how the price moves within a limited range.
Fundamental and macroeconomic factors have a very weak influence on the pair's movement, as the flat "eats up" everything. The sideways movement has been maintained for too long. Three months is a very long time. If no factors affected the pair's decline or rise during this period, then we observe a regular price movement. However, there were enough important reports, events, and information during this time. However, the market still refuses to sell the British pound, and there are no new reasons for an upward movement.
Yesterday, Kansas City Fed President Jeffrey Schmid told traders that the regulator would not rush to lower rates. According to Schmid, there is simply no need for that. High inflation persists, and the economy keeps rates at the maximum level. Why then switch to "pre-emptive easing"? "The Fed should wait for evidence that inflation will drop to 2%. It is not necessary to start lowering the rate when inflation drops to this level. But at the same time, there are currently no grounds to "play ahead," Schmidt believes.
For us, this message was not news. From the beginning of the year, we have been saying and continue to assert that the Fed will start lowering rates when inflation approaches the target level. We have also repeatedly emphasized that the ECB may switch to easing monetary policy much earlier than the market expects, as inflation in the EU and the economy are also weaker. The EU must fear a recession, and inflation is approaching the target level. Thus, the ECB and the Fed may start reducing rates almost simultaneously, which the market refused to believe at the beginning of the year. This conclusion should continue to support the US dollar.
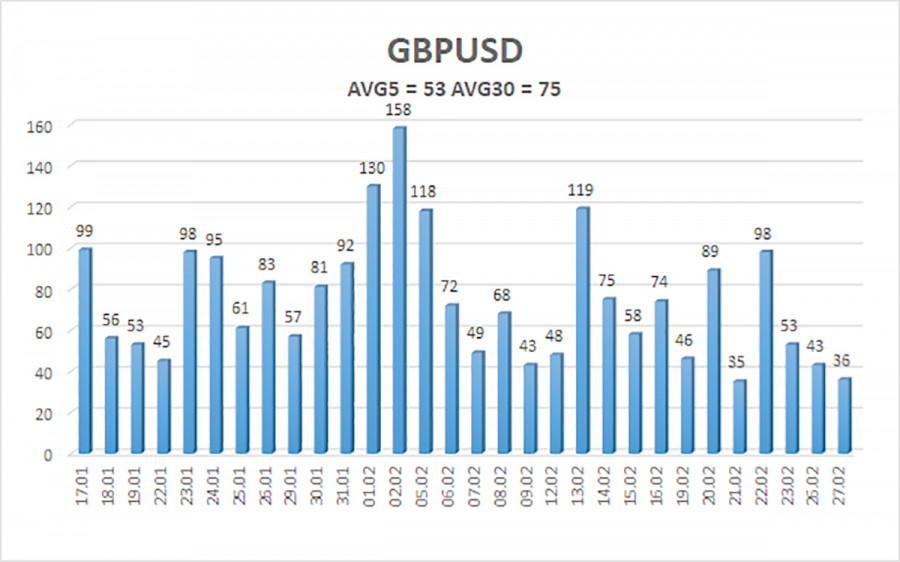
The average volatility of the GBP/USD pair over the last five trading days is 53 points. For the pound/dollar pair, this value is considered "low." Therefore, on Wednesday, February 28, we expect movement within the range limited by the levels of 1.2636 and 1.2742. The senior linear regression channel is sideways, and the junior one is also sideways. Thus, there are no questions about the current trend. The CCI indicator entered the oversold area, so we are now observing another upward movement phase within the flat.
Nearest support levels:
S1 – 1.2665
S2 – 1.2634
S3 – 1.2604
Nearest resistance levels:
R1 – 1.2695
R2 – 1.2726
R3 – 1.2756
Trading Recommendations:
The GBP/USD currency pair has left the sideways channel and may switch to forming a new downward trend soon. However, the current movement again looks more like a flat. The pair managed to move down more than 200 points, which essentially ended the pound's decline. We expect a resumption of movement to the south with targets at 1.2543 and 1.2512. Long positions can only be considered with the price above the moving average, with targets at 1.2665 and 1.2695, and only with a corresponding macroeconomic background. Both targets have already been worked out, and if a downward trend has indeed begun now, then purchases cannot be a priority. However, new signals are needed for buying and selling, which are currently unavailable.
Explanations for the illustrations:
Linear regression channels – help determine the current trend. If both are directed in the same direction, the trend is strong.
The moving average line (settings 20.0, smoothed) – determines the short-term trend and direction in which trading should be conducted.
Murray levels – target levels for movements and corrections.
Volatility levels (red lines) – the likely price channel the pair will spend the next day, based on current volatility indicators.
CCI indicator – its entry into the oversold area (below -250) or overbought area (above +250) means a trend reversal towards the opposite side is approaching.


