Analysis of EUR/USD 5M
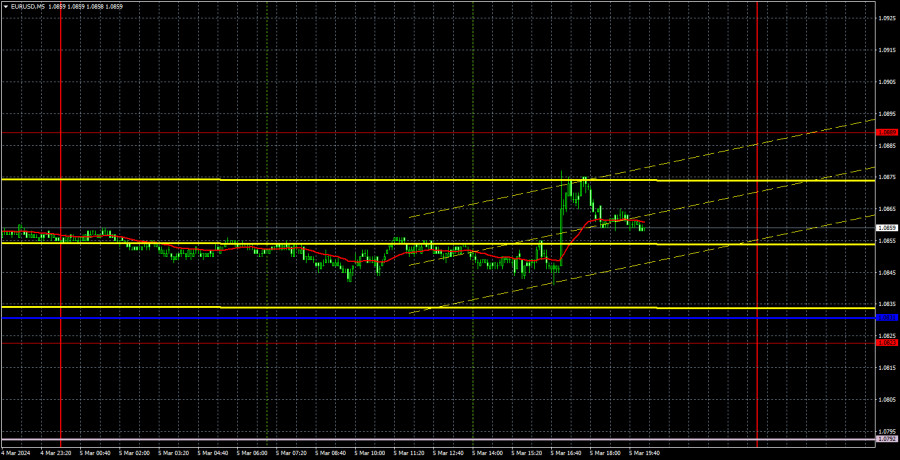
The volatility for the EUR/USD pair did not exceed 40 pips on Tuesday. Thus, the nature of the movement, its strength, has not changed at all. The market nearly ignored several economic reports in the European Union, Germany, and the United States. This is quite natural if we compare it to the business activity indices in the services sectors of Germany and the EU, since these were second estimates that rarely evoke emotions from the market. However, the market responded to the US ISM index with a 30-pip reaction.
The Institute for Supply Management's services-activity index fell to 52.6 in February from 53.4 in January. This isn't exactly a disastrous value, but it is still worse than the previous month as well as forecasts. Therefore, it was logical for traders to sell the dollar in the second half of the day. However, the pair remains within a sideways channel, which is clearly visible, and there is no volatility. No matter what the macroeconomic background is, we shouldn't expect good signals, strong movements, and high profits if the market refuses to be active.
Speaking of trading signals, there is nothing to say. There were no signals, and perhaps this is for the best. In general, the pair moved sideways all day, and it only managed to jump after the release of the US ISM index. We have marked the current position of the Ichimoku indicator lines because the market is flat at the moment.
COT report:
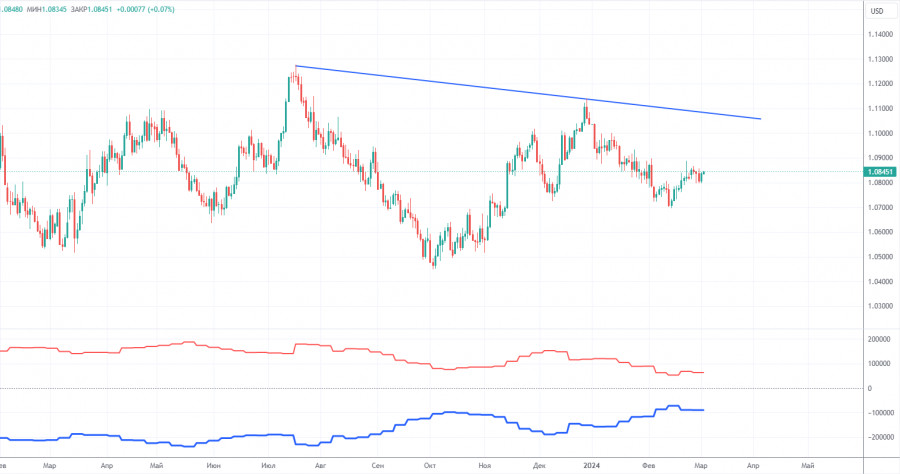
The latest COT report is dated February 27. The net position of non-commercial traders has been persistently bullish for quite some time. Basically, the number of long positions in the market is higher than the number of short positions. However, at the same time, the net position of non-commercial traders has been decreasing in recent months, while that of commercial traders has been increasing. This shows that market sentiment is turning bearish, as speculators are increasing the volume of short positions on the euro. We don't see any fundamental factors that can support the euro's growth in the long term, while technical analysis also points to the formation of a downtrend.
We have already drawn your attention to the fact that the red and blue lines have significantly diverged, often preceding the end of a trend. Currently, these lines are moving towards each other (indicating a trend change). Therefore, we believe that the euro will fall further. During the last reporting week, the number of long positions for the non-commercial group decreased by 7,900, while the number of short positions decreased by 2,800. Accordingly, the net position decreased by 5,100. The number of buy contracts is still higher than the number of sell contracts among non-commercial traders by 63,000 (previously 68,000). Thus, commercial traders continue to sell the euro.
Analysis of EUR/USD 1H
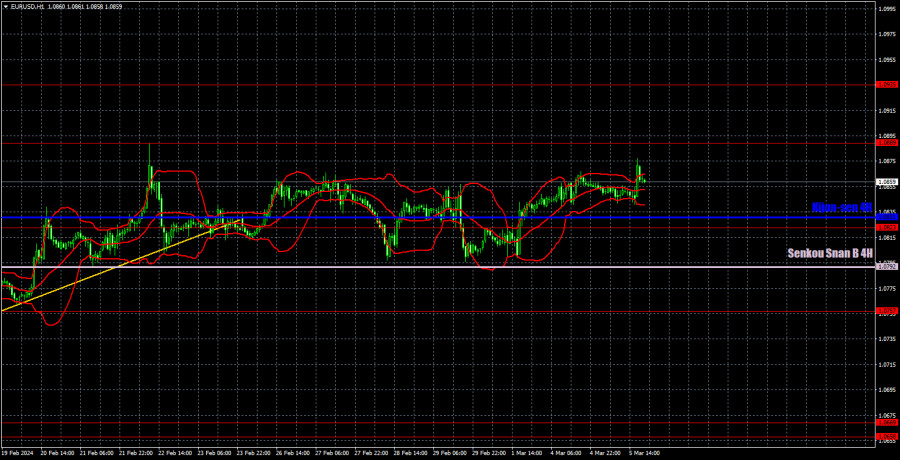
On the 1-hour chart, the uptrend remains intact, but EUR/USD has been moving in a sideways channel of 1.0792-1.0889 for the past two weeks. In our opinion, all the factors currently suggest that the dollar will strengthen. Therefore, we expect the price to consolidate below the Senkou Span B line and the euro to revive the downward movement. The nearest target is the area of 1.0658-1.0669. However, if the market continues to trade in this manner, it will take a very long time until we see any trend.
On March 6, we highlight the following levels for trading: 1.0530, 1.0581, 1.0658-1.0669, 1.0757, 1.0823, 1.0889, 1.0935, 1.1006, 1.1092, as well as the Senkou Span B (1.0792) and Kijun-sen (1.0831) lines. The Ichimoku indicator lines can move during the day, so this should be taken into account when identifying trading signals. Don't forget to set a Stop Loss to breakeven if the price has moved in the intended direction by 15 pips. This will protect you against potential losses if the signal turns out to be false.
EU retail sales are due early Wednesday, while the U.S. will release important data on the labor market and unemployment. In particular, these are the ADP report on private-sector employment and JOLTS Job Openings data. In addition, Federal Reserve Chair Jerome Powell will deliver a speech in Congress, which might be interesting. In the end, we have at least three events that may pull the pair out of its dormant state.
Description of the chart:
Support and resistance levels are thick red lines near which the trend may end. They do not provide trading signals;
The Kijun-sen and Senkou Span B lines are the lines of the Ichimoku indicator, plotted to the 1H timeframe from the 4H one. They provide trading signals;
Extreme levels are thin red lines from which the price bounced earlier. They provide trading signals;
Yellow lines are trend lines, trend channels, and any other technical patterns;
Indicator 1 on the COT charts is the net position size for each category of traders;
Indicator 2 on the COT charts is the net position size for the Non-commercial group.


