empty
 
 
14.03.2024 05:46 PM
GBP/USD. Analysis for March 14th. A dull ending to a contradictory week

This image is no longer relevant

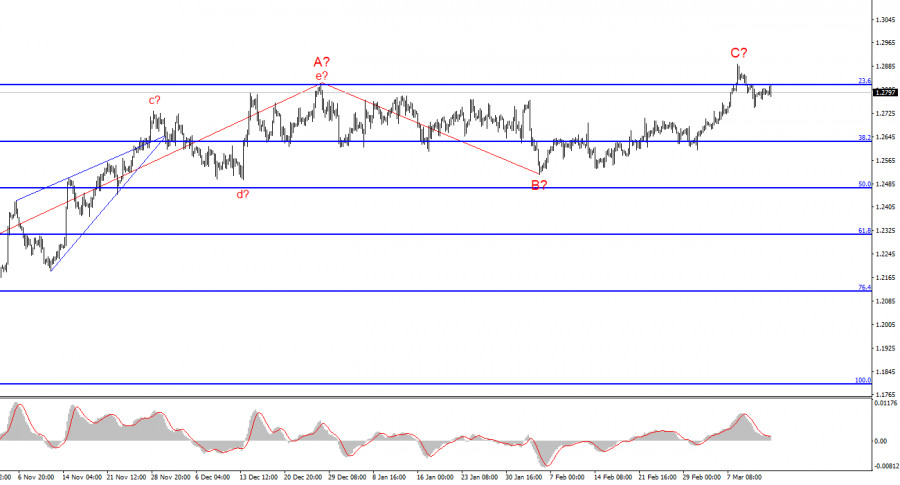
The wave analysis for the GBP/USD pair remains quite clear and, at the same time, complex. The construction of a new downtrend segment continues, the first wave of which has taken on a very prolonged form. The second wave has also turned out to be quite extensive, giving us every reason to expect a prolonged construction of the third wave.

At the moment, I have no confidence that the construction of wave 2 or b is complete. Wave 2 or b has already taken on a three-wave form but has become more complex again due to the increase in British pound quotes last week. Theoretically, wave 2 or b may extend to 100% of wave 1 or a. An unsuccessful attempt to break through the 1.2876 level, which corresponds to 76.4% on the Fibonacci scale, may indicate the long-awaited completion of the upward wave.

The targets for the decline of the pair within the presumed wave 3 or c are below the 1.2039 level, which corresponds to the low of wave 1 or a. Unfortunately, wave analysis tends to become more complex and does not always correspond to the news background. At the moment, I do not abandon the working scenario, but the market does not yet see motives for long-term sales of the pair.

Bulls may continue to retreat from the market in the coming weeks.

The GBP/USD pair's rate declined by 30 basis points on Thursday, but its losses could be much higher by the end of the day. I note that market activity remains low. Demand for the British pound sterling decreased slightly this week, but insignificantly. I cannot yet be confident in the completion of the construction of wave 2 or b, which has been building for several months. Nevertheless, below the 1.2821 level, there are good chances of building an impulsive, downward wave 3 or c.

Today, support for sellers was provided by the US producer price index, which rose significantly stronger in February than the market expected. As I have already mentioned, an increase in inflation means that the Fed may start easing monetary policy even later. And this is a supporting factor for the US currency. In addition to this, demand for the US currency has been falling for too long and not always consistently, so I continue to expect a significant decline in the pair in the coming months.

On Friday, in America, two more reports will be released that could support demand for the dollar. The consumer sentiment index and industrial production may turn out to be better than expected by the market. This especially applies to the University of Michigan index, which unexpectedly fell to 76.9 points a month earlier. I believe that the US currency may end the current week on a positive note.

General conclusions.

The wave picture of the GBP/USD pair still suggests a decline. At the moment, I am considering selling the pair with targets below the 1.2039 level, as I believe that wave 3 or c will start sooner or later. However, as long as wave 2 or b is not complete (with 100% certainty), one can expect the pair to rise to the 1.3140 level, which corresponds to 100.0% on the Fibonacci scale. A successful attempt to break through the 1.2877 level, which equates to 76.4% on the Fibonacci scale, will indicate the market's readiness to further increase demand. However, at the moment, it is unsuccessful, so the construction of wave 3 or c may have already begun.

On a larger wave scale, the picture for the EUR/USD pair is similar, but there are still some differences. The descending correctional trend segment continues to be built, and its second wave has taken on a prolonged form – up to 61.8% of the first wave. An unsuccessful attempt to break through this level may lead to the beginning of the construction of wave 3 or c.

The main principles of my analysis:

  1. Wave structures should be simple and understandable. Complex structures are difficult to play with and often change.
  2. If there is no confidence in what is happening in the market, it is better not to enter it.
  3. There is never 100 percent certainty about the direction of movement. Do not forget about protective stop-loss orders.
  4. Wave analysis can be combined with other types of analysis and trading strategies.
Chin Zhao,
انسٹافاریکس کا تجزیاتی ماہر
© 2007-2024
انسٹافاریکس کے ساتھ کرپٹو کرنسی کی معاملاتی تبدیلیوں سے کمائیں۔
میٹا ٹریڈر 4 ڈاؤن لوڈ کریں اور اپنی پہلی ٹریڈ کھولیں۔
  • Grand Choice
    Contest by
    InstaForex
    InstaForex always strives to help you
    fulfill your biggest dreams.
    مقابلہ میں شامل ہوں
  • چانسی ڈیپازٹ
    اپنے اکاؤنٹ میں 3000 ڈالر جمع کروائیں اور حاصل کریں$5000 مزید!
    ہم نومبر قرعہ اندازی کرتے ہیں $5000چانسی ڈیپازٹ نامی مقابلہ کے تحت
    اپنے اکاؤنٹ میں 3000 ڈالر جمع کروانے پر موقع حاصل کریں - اس شرط پر پورا اُترتے ہوئے اس مقابلہ میں شرکت کریں
    مقابلہ میں شامل ہوں
  • ٹریڈ وائز، ون ڈیوائس
    کم از کم 500 ڈالر کے ساتھ اپنے اکاؤنٹ کو ٹاپ اپ کریں، مقابلے کے لیے سائن اپ کریں، اور موبائل ڈیوائسز جیتنے کا موقع حاصل کریں۔
    مقابلہ میں شامل ہوں
  • 100 فیصد بونس
    اپنے ڈپازٹ پر 100 فیصد بونس حاصل کرنے کا آپ کا منفرد موقع
    بونس حاصل کریں
  • 55 فیصد بونس
    اپنے ہر ڈپازٹ پر 55 فیصد بونس کے لیے درخواست دیں
    بونس حاصل کریں
  • 30 فیصد بونس
    ہر بار جب آپ اپنا اکاؤنٹ ٹاپ اپ کریں تو 30 فیصد بونس حاصل کریں
    بونس حاصل کریں

تجویز کردہ مضامین

ابھی فوری بات نہیں کرسکتے ؟
اپنا سوال پوچھیں بذریعہ چیٹ.
Widget callback