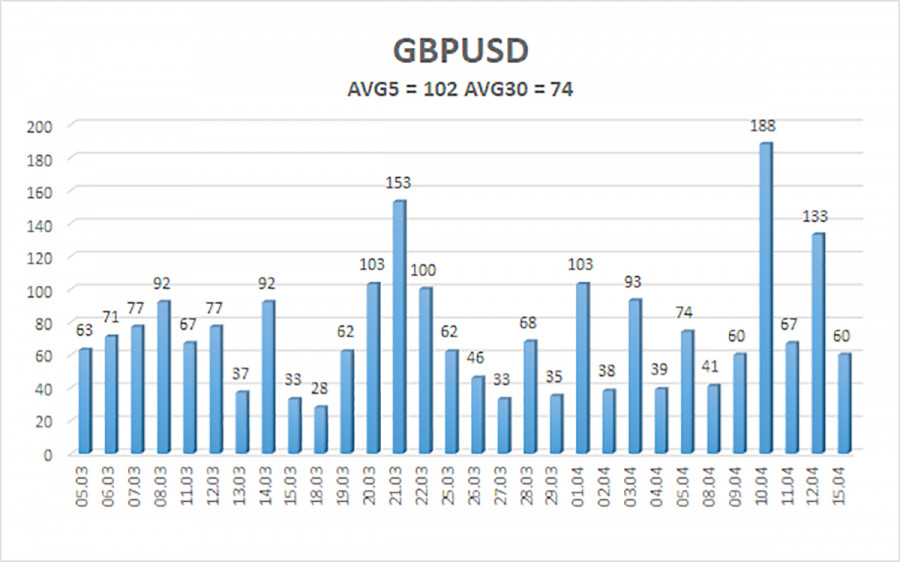
After a three-day decline, the GBP/USD currency pair started an upward correction on Monday. The correction, as well as the pair's volatility during the day, was weak. If we exclude Wednesday and Friday of last week, the pound's volatility has remained quite low for over two months, greatly hindering trading. However, important events will also occur this week, particularly the UK inflation report. Therefore, we will most likely see volatile movements. The question is, in which direction?
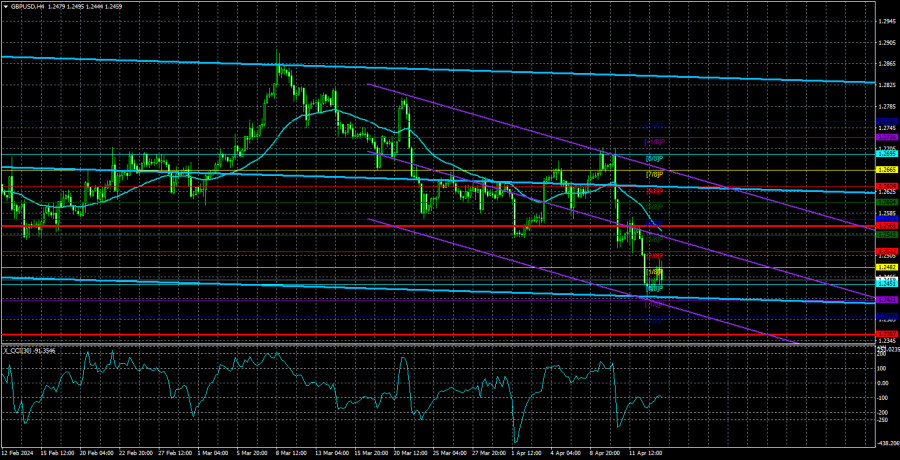
Last week, the British pound fell below the 1.2500 level for the first time in 4 months, the approximate lower boundary of the sideways channel on the 24-hour timeframe. Thus, there are grounds to assert that the flat is over and the downward trend will resume. The technical picture confirms this. However, this hypothesis still allows for a small amount of doubt. The market has refused to sell the pound for six months. The problem may lie not in the market itself but in the Bank of England, which, through currency interventions, prevents the pound from falling. After all, the British currency has been at a downward peak for 16 years and has depreciated against the dollar by half during this time. It's unlikely that the British regulator can sit back and watch the pound fall even further, considering the general dissatisfaction with its actions and policies among the British population.
Therefore, we still doubt that the pound will suddenly collapse by 500–600 points, as the macroeconomic background, fundamental factors, and technical picture demand. However, if we abstract from various fantasies, the pound should decline against the dollar without options. The market was expecting a Fed rate cut in March and didn't get it. I expected it in June and still need to get it. At the same time, British inflation may fall below American inflation this week, so even the Bank of England, which had to deal with higher inflation than the Fed, may start easing monetary policy sooner. Naturally, this is a bullish factor for the dollar and a bearish one for the pound.
However, if inflation in the UK is also not rushing towards the target level of 2%, the pound may show a new upward trend. This trend is imminent anyway, as the CCI indicator has twice entered oversold territory, and this same indicator has formed a bullish divergence. A correction would be a logical development after a three-day decline of 260 points. However, after the correction is completed, we still expect a new decline in the pair. The inflation report from the UK will indicate whether we should expect a significant decline in the pound or if it will be limited to a gradual movement towards the 1.2050 level, which could take 3-6 months. Either way, there are no buy signals in any timeframe.

The average volatility of the GBP/USD pair over the last five trading days is 102 points. For the pound/dollar pair, this value is considered "average." Thus, on Tuesday, April 16, we expect movement within the range bounded by the levels of 1.2357 and 1.2561. The senior channel of linear regression is still sideways, but the downward trend may have resumed. The CCI indicator has again entered oversold territory, which could trigger a new rise in the pair. However, the completion of the 4-month flat remains crucial at the moment.
Nearest support levels:
S1 – 1.2451
S2 – 1.2421
S3 – 1.2390
Nearest resistance levels:
R1 – 1.2482
R2 – 1.2512
R3 – 1.2543
Trading recommendations:
The GBP/USD currency pair presumably completed the flat on the 24-hour TF, which is the most important. We still expect movement only to the south, and now that the 1.2500 level has been surpassed, sales of the pair with targets at 1.2390 and 1.2357 can be considered. Buying the British pound when the price exits the sideways channel through the lower boundary is irrelevant. The pair may rebound upwards this week, as the CCI indicator has twice entered oversold territory, but we do not consider it advisable to trade this correction.
Illustration explanations:
Linear regression channels - help determine the current trend. The trend is strong now if both are directed in the same direction.
Moving average line (settings 20.0, smoothed) - determines the short-term trend and direction in which trading should be conducted now.
Murray levels - target levels for movements and corrections.
Volatility levels (red lines) - the likely price channel the pair will spend the next day, based on current volatility indicators.
CCI indicator - its entry into oversold territory (below -250) or overbought territory (above +250) means a trend reversal towards the opposite direction is approaching.


