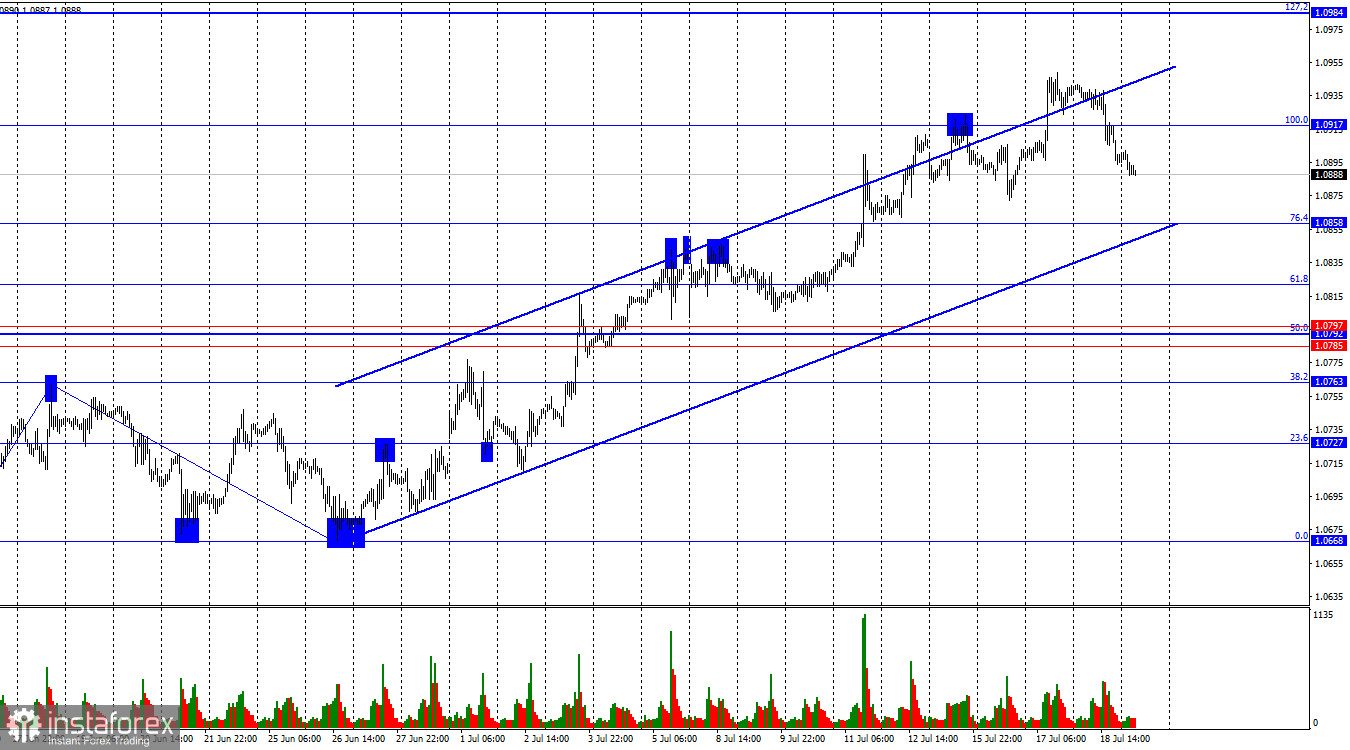
The EUR/USD pair reversed in favor of the US dollar on Thursday and fell, consolidating below the 100.0% corrective level at 1.0917. The decline in quotes may now continue towards the next Fibonacci level of 76.4% at 1.0858. A rebound from the lower line of the upward trend channel will favor the euro and maintain the "bullish" trend. In this case, the growth in quotations will resume. Consolidation below the channel will indicate the end of the "bullish" trend.
The wave pattern has become more complicated. The new upward wave broke the peak of the previous wave and continued to form, while the last completed downward wave failed to break the low of the preceding wave. Thus, two signs indicating a trend change from "bearish" to "bullish" were observed. The information background has supported only bull traders for over two weeks. Thus, the bears currently do not have the opportunity to form even a corrective wave. Currently, there are no signs of a trend change to "bearish."
The information on Thursday did not give the bears any chance to recover even a little. However, a miracle happened, and the US dollar showed growth. The ECB did not make important decisions regarding monetary policy. However, Christine Lagarde stated at the press conference that a decision on a rate cut in September has yet to be made. Further monetary policy easing will be appropriate only if inflation in the Eurozone continues to slow down. The regulator will pay special attention to core inflation and inflation in the services sector, which is slowing down much more slowly than the main indicator. According to Lagarde, a decision will be made on whether a rate cut is appropriate in September. If not, the ECB will extend the pause. Strictly speaking, the market had the opportunity to buy the euro yesterday, but has been doing so for the past three weeks. Traders have already factored in the most "hawkish" decision possible by the ECB.
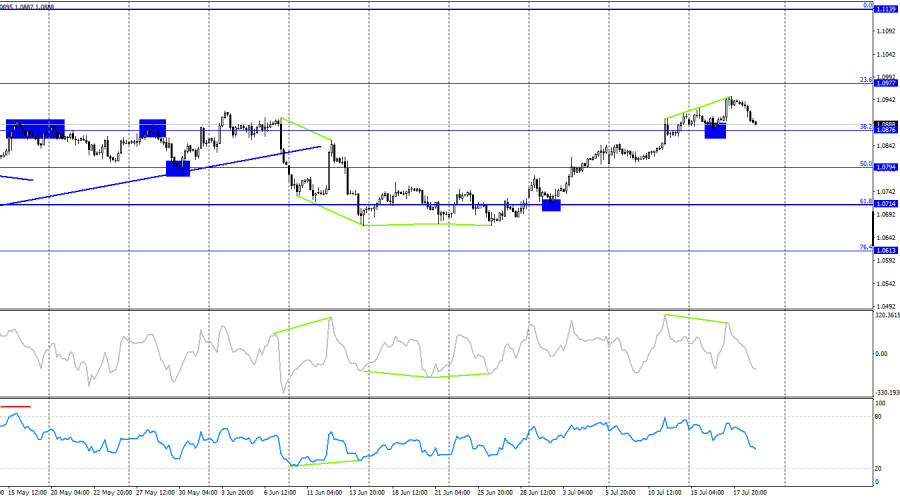
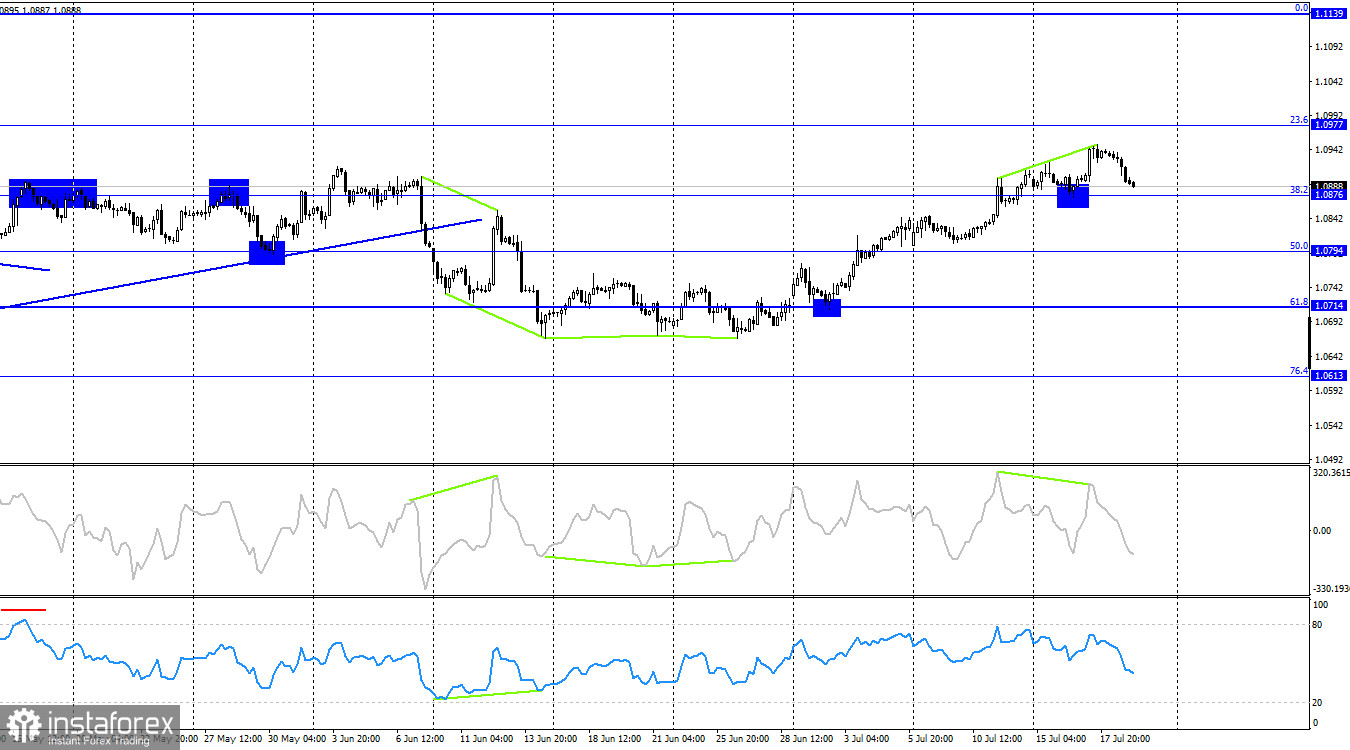
On the 4-hour chart, the pair consolidated above the corrective level of 38.2% at 1.0876. Thus, the growth process may continue towards the next Fibonacci level of 23.6% at 1.0977. The CCI indicator formed a "bearish" divergence, which allowed the decline to begin. On the hourly chart, a corrective wave needs to form, and there are sell signals indicating a potential fall to the lower line of the upward channel. Therefore, in the near future, the euro will continue declining.
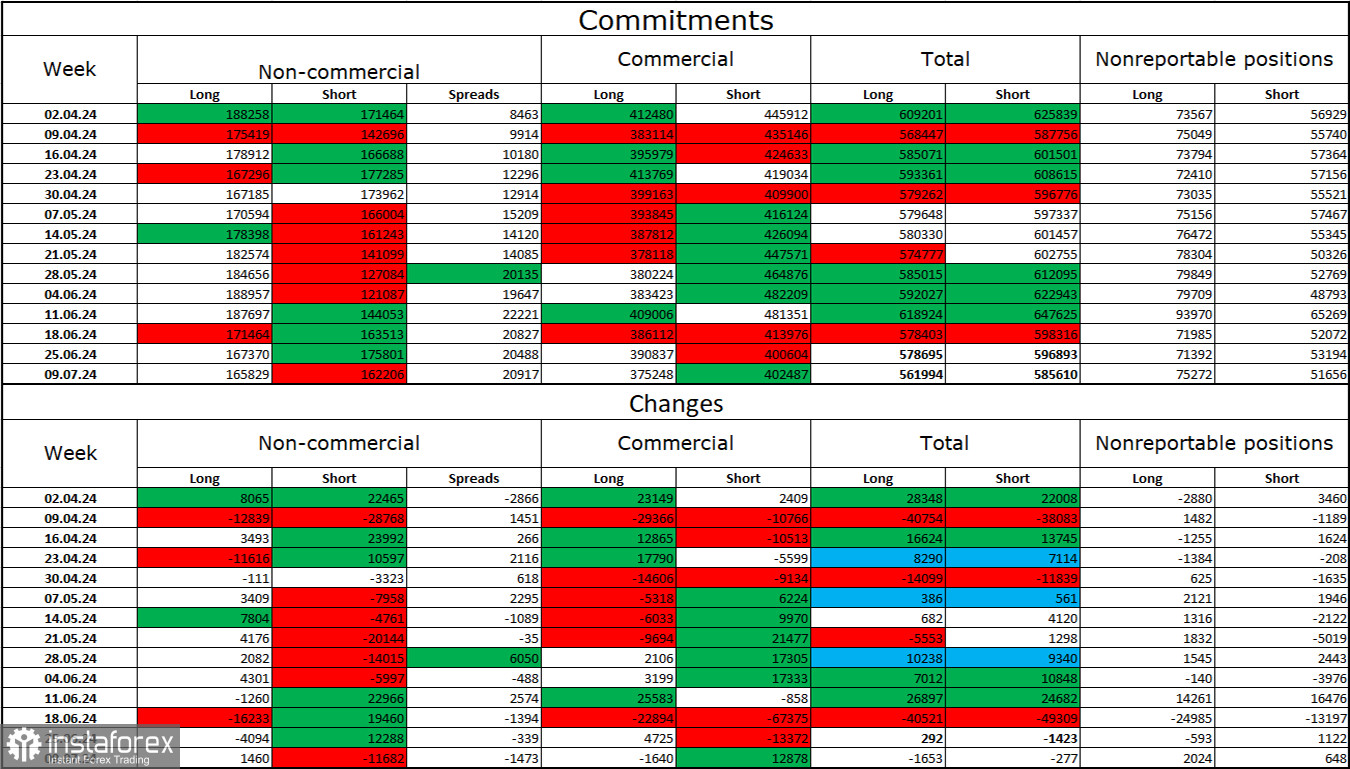
Commitments of Traders (COT) report:
During the last reporting week, speculators opened 1,460 long positions and closed 11,682 short positions. The sentiment of the "Non-commercial" group turned "bearish" a few weeks ago, but currently, there is an equilibrium between bulls and bears. The total number of long positions held by speculators now stands at 165 thousand, while short positions total 162 thousand.
The situation will continue to change in favor of the bears. I do not see long-term reasons to buy euros since the ECB has begun easing monetary policy, which will reduce the yield on bank deposits and government bonds. However, they will remain at high levels in America for several months, making the dollar more attractive to investors. The potential for a decline in the euro looks substantial, even according to the COT reports. The number of short positions among professional players is currently growing. However, it is important to consider graphical analysis, which currently suggests opposite conclusions.
News calendar for the USA and the Eurozone:
The economic events calendar does not contain any important entries on July 19. Therefore, the information background will not influence traders' sentiment today.
Forecast for EUR/USD and advice to traders:
Selling the pair was possible upon consolidation below the level of 1.0917 on the hourly chart, targeting 1.0858. These trades can now be kept open. Buying will become possible on a rebound from the level of 1.0858 on the hourly chart with a target of 1.0917.
The Fibonacci grid levels are based on 1.0917 – 1.0668 on the hourly chart and 1.0450 – 1.1139 on the 4-hour chart.