Analyzing Wednesday's trades:
EUR/USD on 1H chart
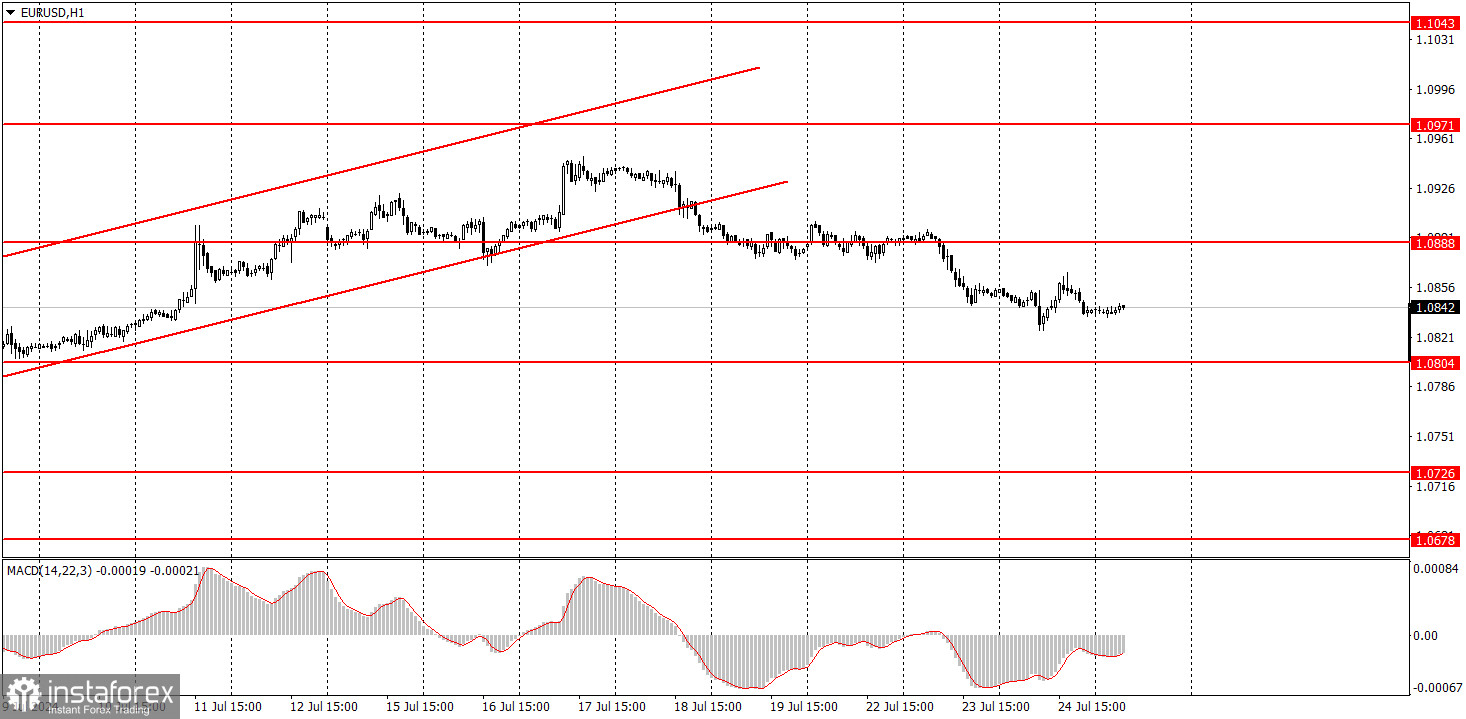
EUR/USD continued its sluggish movements on Wednesday. A new downward trend began after the price broke out of the ascending channel. However, pay attention to the pace at which the price moves downward. Over three days, it has dropped 60 pips, which is about 20 pips a day. This is how the pair has been trading for the past 3-4 months. Yesterday, the Eurozone and the U.S. finally released the first reports of the week, but they only confused traders. Without these reports, the pair might have continued its sluggish downward movement or gradually started a bullish correction. Instead, due to the impact of the economic reports, we saw two intraday reversals that further complicated the pair's movement. Eurozone PMI data came in worse than expected, which led to the euro's decline in the morning. Later, the U.S. manufacturing activity index fell below 50.0, which put pressure on the dollar. Overall, the pair is expected to continue its downward trend, but as we have often said, it could be slow and erratic.
EUR/USD on 5M chart
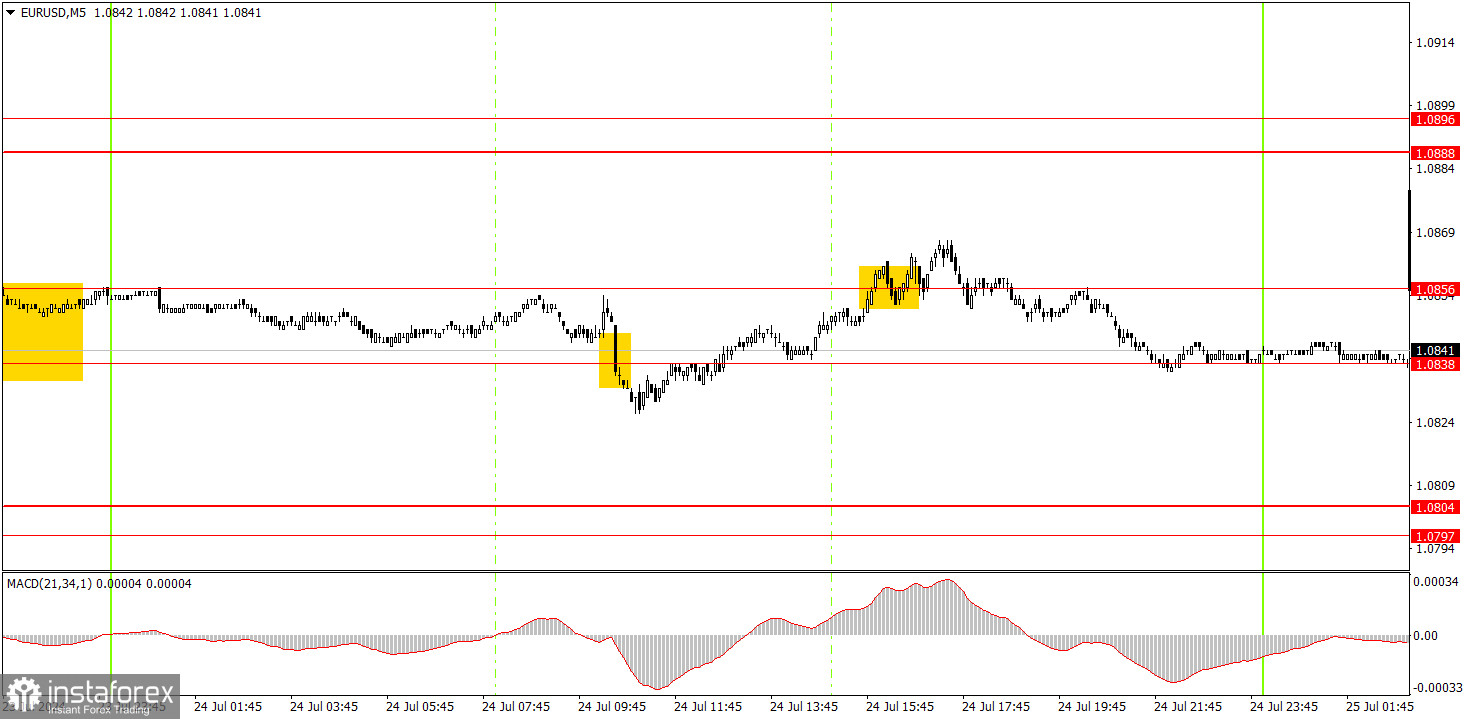
In the 5-minute timeframe, the reversals mentioned above are visible and negatively impacted intraday trading. The price initially settled below the 1.0838-1.0856 range and then above it. The price did not move in the intended direction by even ten pips. Therefore, if novice traders acted on these signals, they likely only incurred losses. Unfortunately, the economic reports were more of a hindrance than a help on Wednesday.
Trading tips on Thursday:
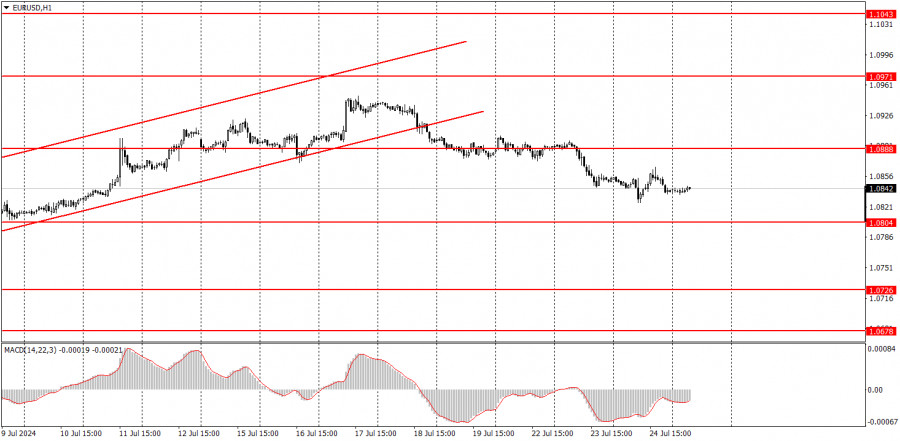
In the hourly timeframe, EUR/USD settled below the ascending channel, allowing it to start a new local downward trend. In our opinion, the euro has fully factored in all the bullish factors, so a significant correction is needed. However, the nature of the movements is best seen in the 24-hour timeframe. It is the same flat range between 1.0650 and 1.1000.
On Thursday, novice traders may try trading from the 1.0838-1.0856 area. There will be a few important events today, but yesterday, we already saw how economic reports can disrupt the technical picture. We fully anticipate a possible upward move in quotes, after which the decline may resume.
The key levels to consider on the 5M timeframe are 1.0526, 1.0568, 1.0611, 1.0678, 1.0726-1.0733, 1.0797-1.0804, 1.0838-1.0856, 1.0888-1.0896, 1.0940, 1.0971-1.0981. Today, European Central Bank President Christine Lagarde will speak, and the U.S. will release important reports on durable goods orders and Q2 GDP. We wouldn't be surprised if there is no reaction to these events, as the figures may be completely neutral.
Basic rules of a trading system:
1) The strength of a signal is determined by the time it took for the signal to form (bounce or level breakthrough). The shorter the time required, the stronger the signal.
2) If two or more trades around a certain level are initiated based on false signals, subsequent signals from that level should be ignored.
3) In a flat market, any currency pair can produce multiple false signals or none at all. In any case, it's better to stop trading at the first signs of a flat market.
4) Trades should be opened between the start of the European session and mid-way through the U.S. session. All trades must be closed manually after this period.
5) In the hourly time frame, trades based on MACD signals are only advisable amidst substantial volatility and an established trend, confirmed either by a trendline or trend channel.
6) If two levels are too close to each other (from 5 to 20 pips), they should be considered as a support or resistance zone.
7) After moving 15 pips in the intended direction, the Stop Loss should be set to break-even.
What the charts show:
Support and Resistance price levels can serve as targets when buying or selling. You can place Take Profit levels near them.
Red lines represent channels or trend lines that depict the current trend and indicate the preferred trading direction.
The MACD (14,22,3) indicator, encompassing both the histogram and signal line, acts as an auxiliary tool and can also be used as a source of signals.
Important speeches and reports (always noted in the news calendar) can profoundly influence the price dynamics. Hence, trading during their release calls for heightened caution. It may be reasonable to exit the market to prevent abrupt price reversals against the prevailing trend.
Beginners should always remember that not every trade will yield profit. Establishing a clear strategy, coupled with effective money management, is key to long-term success in trading.